IELTS Writing Task 1 Bar Chart: Fire Incidents
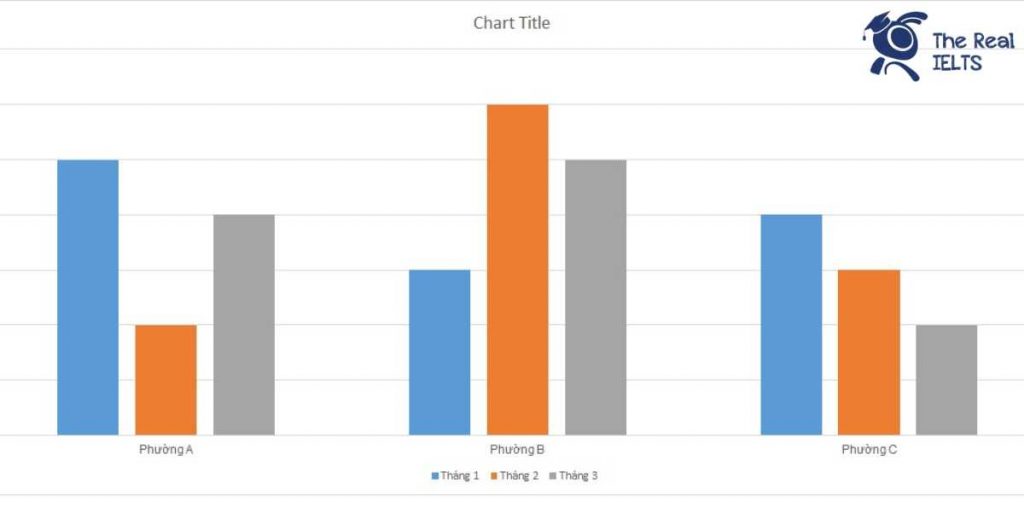

IELTS Writing Task 1 yêu cầu thí sinh miêu tả và phân tích biểu đồ Bar Chart về số lượng vụ cháy nổ trong ba tháng của ba phường.
IELTS Writing Task 1 Bar Chart: Bad Debt
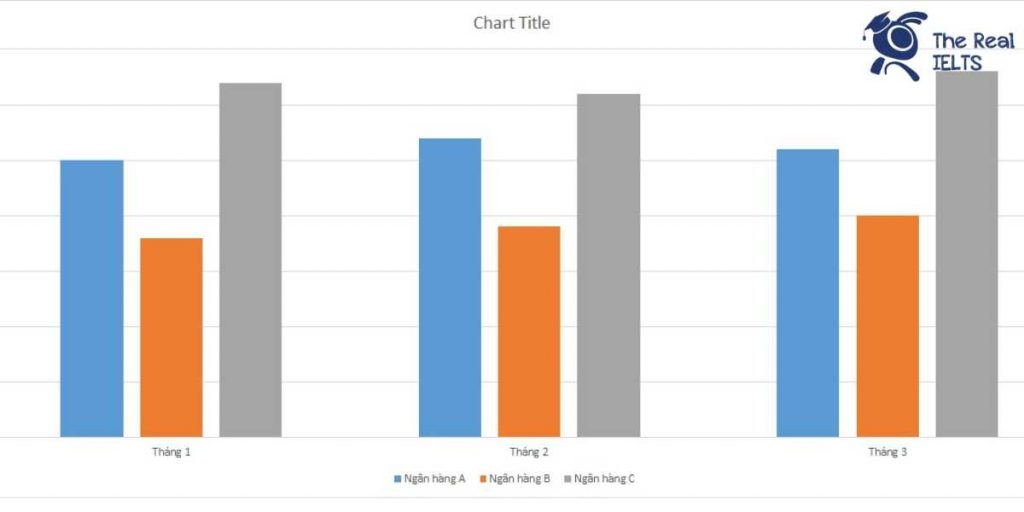

IELTS Writing Task 1 yêu cầu phân tích biểu đồ bar chart về tỷ lệ nợ xấu trong 3 tháng của ba ngân hàng.
IELTS Writing Task 1 Bar Chart: Downloads
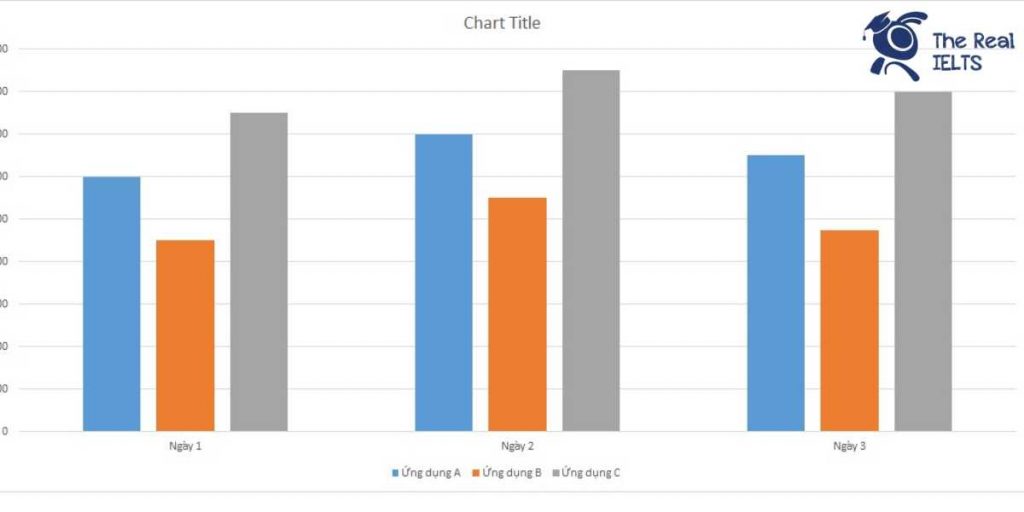

IELTS Writing Task 1 yêu cầu thí sinh mô tả biểu đồ Bar Chart về số lượt tải ứng dụng trong ba ngày của ba ứng dụng khác nhau.
IELTS Writing Task 1 Bar Chart: Living Expenses
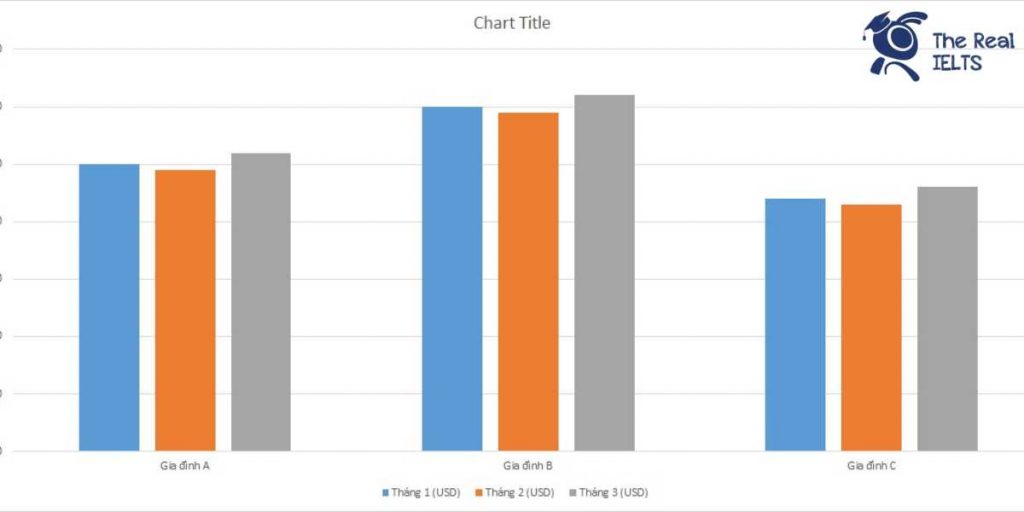

IELTS Writing Task 1 yêu cầu mô tả biểu đồ Bar Chart về chi phí sinh hoạt trong 3 tháng của 3 gia đình.
IELTS Writing Task 1 Bar Chart: Milk Consumption
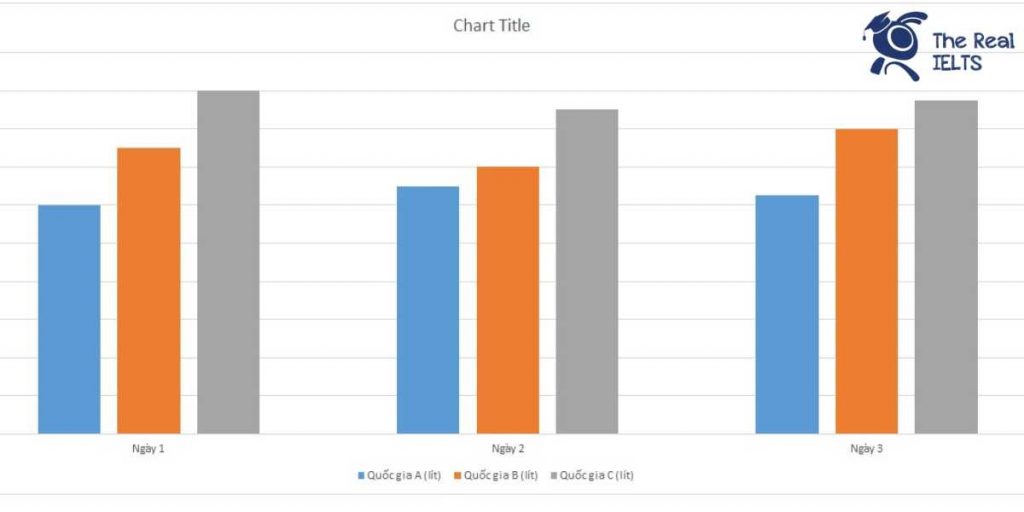

IELTS Writing Task 1 yêu cầu thí sinh phân tích biểu đồ Bar Chart về lượng tiêu thụ sữa trong 3 ngày tại ba quốc gia khác nhau. Thí sinh cần miêu tả các xu hướng chính, so sánh sự khác biệt và sự tương đồng giữa các quốc gia. Bài viết phải rõ ràng, logic và sử dụng ngôn ngữ học thuật, bao gồm từ vựng và cấu trúc câu phù hợp để diễn đạt chính xác thông tin từ biểu đồ. Đọc bài này Cách làm bài IELTS Writing Task 1 Bar Chart trước khi làm bài. Bạn cũng có thể đọc lại bài nói về Task 1 tại đây: IELTS Writing Task 1 cần lưu ý những gì? Đọc thêm về xây dựng lộ trình học IELTS của The Real IELTS. IELTS Writing Task 1 Bar Chart: Milk Consumption You should spent about 20 mintutes on this task IELTS Writing Task 1 requires candidates to analyze a Bar Chart depicting milk consumption over 3 days in three different countries. Candidates need to describe the main trends, compare the differences, and similarities between the countries. The writing should be clear, logical, and use academic language, including appropriate vocabulary and sentence structures to accurately convey the information from the chart. You should write at least 150 words Ngày Quốc gia A (lít) Quốc gia B (lít) Quốc gia C (lít) Ngày 1 1,200 1,500 1,800 Ngày 2 1,300 1,400 1,700 Ngày 3 1,250 1,600 1,750 Bài mẫu 1 The bar chart illustrates the consumption of milk over a three-day period in three different countries: Country A, Country B, and Country C. The data is presented in liters for each day. On Day 1, Country C consumed the highest amount of milk at 1,800 liters, followed by Country B with 1,500 liters, and Country A with 1,200 liters. This trend indicates that Country C had the greatest demand for milk on the first day. On Day 2, the milk consumption patterns changed slightly. Country A increased its consumption to 1,300 liters, surpassing its Day 1 consumption. Country B, however, saw a decrease, consuming 1,400 liters. Country C also reduced its milk intake to 1,700 liters. Despite the decrease, Country C remained the highest consumer among the three countries. On Day 3, Country A’s milk consumption dropped slightly to 1,250 liters, while Country B increased its consumption to 1,600 liters, becoming the highest consumer on this day. Country C consumed 1,750 liters of milk, a slight increase from the previous day but still lower than its Day 1 consumption. Overall, the data reveals that Country C consistently had the highest milk consumption over the three days, though there was a slight decrease from Day 1 to Day 2. Country B showed some fluctuations, ending as the highest consumer on Day 3. Country A had the lowest consumption on all three days, with a minor increase on Day 2 and a subsequent decrease on Day 3. In comparing the three countries, it is evident that while all three exhibited varying levels of milk consumption, Country C generally led in consumption, indicating a higher demand or preference for milk. The variations in consumption patterns could be attributed to different factors such as population size, dietary habits, or availability of milk. These factors would require further investigation to understand the underlying reasons for the observed trends. Bài mẫu 2 The bar chart illustrates milk consumption over three days in three different countries: Country A, Country B, and Country C. The data is presented in liters. On the first day, Country C leads in milk consumption with 1,800 liters, followed by Country B with 1,500 liters, and Country A with the least consumption at 1,200 liters. On the second day, all three countries show a decrease in consumption. Country C remains the highest consumer at 1,700 liters, despite a drop, while Country A increases its consumption slightly to 1,300 liters. Country B, however, experiences a decline, consuming 1,400 liters. The third day shows an interesting trend: Country B’s milk consumption increases significantly to 1,600 liters, surpassing its consumption on the first two days. Country C’s consumption rises slightly to 1,750 liters but remains lower than on the first day. Meanwhile, Country A sees a minor decrease from the second day, with 1,250 liters consumed. Overall, the data indicates that Country C consistently consumes the most milk over the three days, despite fluctuations. Country B shows variability, with the highest consumption on the third day. Country A, although having the lowest consumption, shows a generally stable pattern with a slight increase on the second day and a marginal decrease on the third day. These trends suggest differing consumption habits and possible influencing factors in each country.
Cấu trúc “even if” sử dụng trong IELTS Writing

Một trong những cấu trúc có thể giúp nâng cao chất lượng bài viết của bạn là “even if”.
100 câu bài tập giới từ trong tiếng Anh.

Bài tập điền giới từ là một phần quan trọng trong việc học ngữ pháp tiếng Anh. Các bài tập này giúp người học nâng cao kỹ năng sử dụng các giới từ trong câu một cách chính xác


