IELTS Writing Task 1 Bar Chart: Job Applications
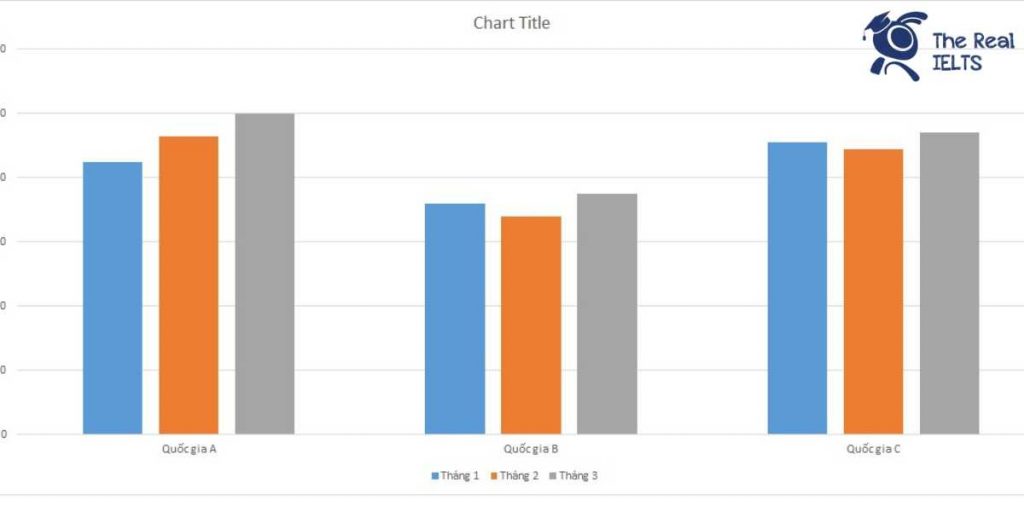

IELTS Writing Task 1 yêu cầu phân tích biểu đồ bar chart về số lượng đơn xin việc trong 3 tháng của ba quốc gia.
IELTS Writing Task 1 Bar Chart: Newspapers
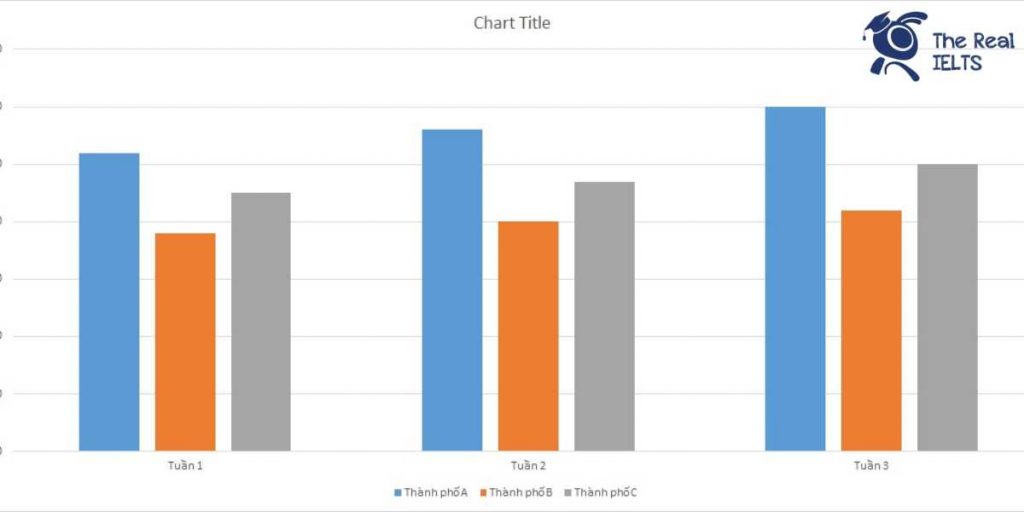

IELTS Writing Task 1 yêu cầu mô tả lượng tiêu thụ sách báo trong 3 tuần của ba thành phố dựa trên biểu đồ thanh (Bar Chart).
IELTS Writing Task 1 Bar Chart: Electronic Banking
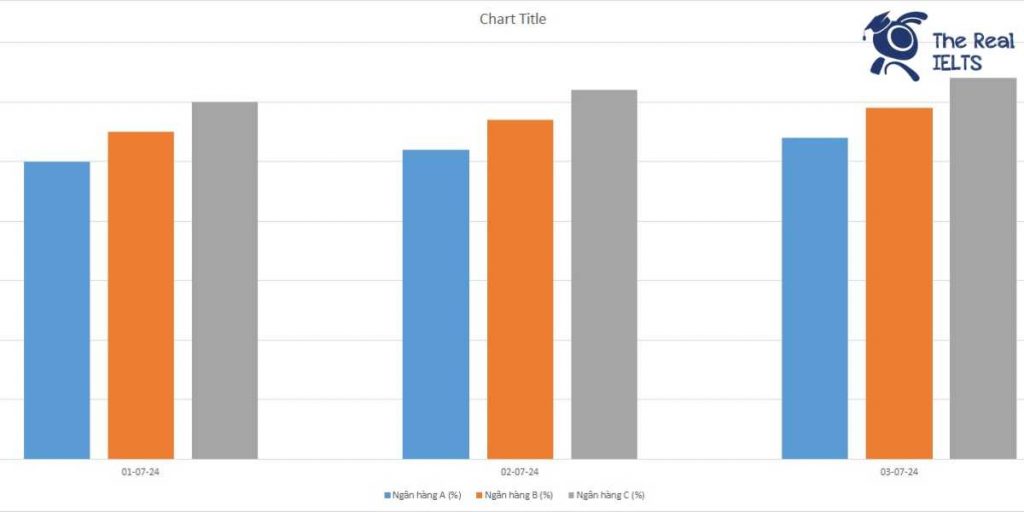

IELTS Writing Task 1 yêu cầu thí sinh mô tả biểu đồ Bar Chart về tỷ lệ sử dụng dịch vụ ngân hàng điện tử trong 3 ngày của 3 ngân hàng khác nhau. Biểu đồ này so sánh mức độ sử dụng các dịch vụ ngân hàng trực tuyến tại Ngân hàng A, B, và C, qua ba ngày cụ thể. Thí sinh cần phân tích và trình bày sự khác biệt, xu hướng tăng giảm và so sánh tỷ lệ giữa các ngân hàng. Đọc bài này Cách làm bài IELTS Writing Task 1 Bar Chart trước khi làm bài. Bạn cũng có thể đọc lại bài nói về Task 1 tại đây: IELTS Writing Task 1 cần lưu ý những gì? Đọc thêm về xây dựng lộ trình học IELTS của The Real IELTS. IELTS Writing Task 1 Bar Chart: Electronic Banking You should spent about 20 mintutes on this task IELTS Writing Task 1 requires candidates to describe a Bar Chart illustrating the usage rates of electronic banking services over 3 days for 3 different banks. This chart compares the usage levels of online banking services at Bank A, Bank B, and Bank C over specific days. Candidates need to analyze and present the differences, trends, and compare the rates between the banks. You should write at least 150 words. Ngày Ngân hàng A (%) Ngân hàng B (%) Ngân hàng C (%) 01-07-24 50 55 60 02-07-24 52 57 62 03-07-24 54 59 64 Bài mẫu 1 Overview The usage of electronic banking services has seen significant growth in recent years. This trend is evident across various banks as more customers opt for the convenience and efficiency of online banking. In this hypothetical analysis, we will examine the daily usage percentages of three banks over a period of three days. The banks in question are Bank A, Bank B, and Bank C. Body 1 Starting with Bank A, the data shows a fluctuation in the usage of electronic banking services over the three-day period. On Day 1, the usage was 25%. This figure increased to 30% on Day 2, indicating a growing adoption among customers. However, on Day 3, the usage slightly decreased to 28%. This small decline might suggest a temporary dip or possibly the impact of external factors such as technical issues or user experience challenges. Nonetheless, the overall trend for Bank A remains positive with a clear upward trajectory from Day 1 to Day 3. Body 2 Bank B and Bank C also exhibit interesting patterns in their electronic banking service usage. For Bank B, the usage started at 20% on Day 1 and showed a gradual increase to 22% on Day 2 and 25% on Day 3. This steady rise reflects a consistent increase in user engagement and trust in the bank’s electronic services. Similarly, Bank C saw usage grow from 18% on Day 1 to 20% on Day 2 and then to 23% on Day 3. Although the initial usage was lower compared to Bank A and Bank B, the upward trend in Bank C’s data suggests a growing customer base for their electronic banking services. This consistent increase across all three banks highlights a broader trend towards the adoption of digital banking solutions. Bài mẫu 2 Overview The usage of electronic banking services is a key indicator of a bank’s technological adoption and customer engagement. This essay will analyze the hypothetical data of three banks over three days to understand trends and patterns. The banks in question are Bank A, Bank B, and Bank C, and their usage percentages over three days provide insights into customer behavior and preferences. Body 1 Bank A Bank A shows a notable fluctuation in its electronic banking service usage. On Day 1, the usage rate is 25%, which increases to 30% on Day 2. This rise indicates a significant uptick in customer engagement, potentially due to promotional activities or improved service features. However, by Day 3, the usage slightly drops to 28%. Despite this minor decrease, Bank A maintains the highest usage rates among the three banks, suggesting a robust and stable customer base that frequently utilizes electronic banking services. Body 2 Bank B and Bank C Bank B and Bank C exhibit more gradual increases in their electronic banking service usage. Bank B starts at 20% on Day 1, slightly rising to 22% on Day 2, and reaching 25% on Day 3. This steady growth reflects a consistent improvement in customer adoption of digital services. Bank C, on the other hand, has the lowest initial usage rate of 18% on Day 1. However, it shows a similar upward trend, increasing to 20% on Day 2 and 23% on Day 3. This consistent growth for both banks highlights a positive trend in customer engagement, although at a slower pace compared to Bank A. In summary, the data suggests that while all three banks are experiencing growth in electronic banking service usage, Bank A leads with the highest and most fluctuating rates, whereas Bank B and Bank C show steady and gradual increases. This analysis helps in understanding customer preferences and the effectiveness of electronic banking services offered by these banks.
IELTS Writing Task 1 Bar Chart: Business Registration
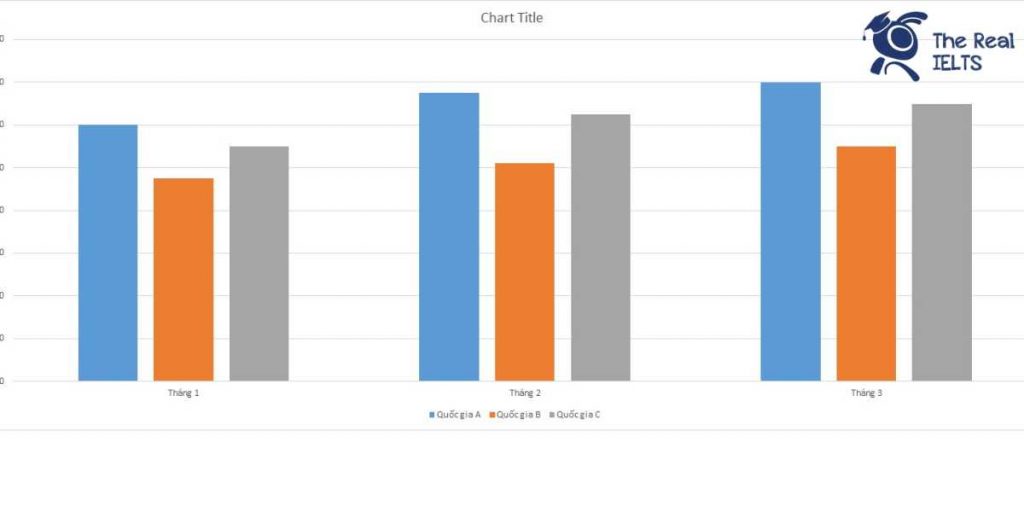

IELTS Writing Task 1 yêu cầu mô tả số lượng hồ sơ đăng ký kinh doanh trong ba tháng tại ba quốc gia, được trình bày qua biểu đồ cột.
100 câu bài tập về câu phức trong tiếng Anh


Câu phức trong tiếng Anh là loại câu kết hợp ít nhất hai mệnh đề: mệnh đề chính và mệnh đề phụ. Mệnh đề chính diễn tả ý chính của câu, trong khi mệnh đề phụ bổ sung thông tin chi tiết hơn.
100 dạng bài tập ngữ pháp tiếng Anh

Để dễ dàng hơn cho các bạn theo dõi các bài tập bình thường trong website The Real IELTS chúng tôi biên soạn lại các dạng bài tập ngữ pháp tiếng Anh cho các bạn dễ theo dõi và ôn tập.
Cấu trúc “in the event that” sử dụng trong IELTS Writing và 100 câu ví dụ


Cấu trúc “in the event that” để nêu rõ điều kiện xảy ra hành động trong IELTS Writing
IELTS Writing Task 1 Bar Chart: Cancer Rates
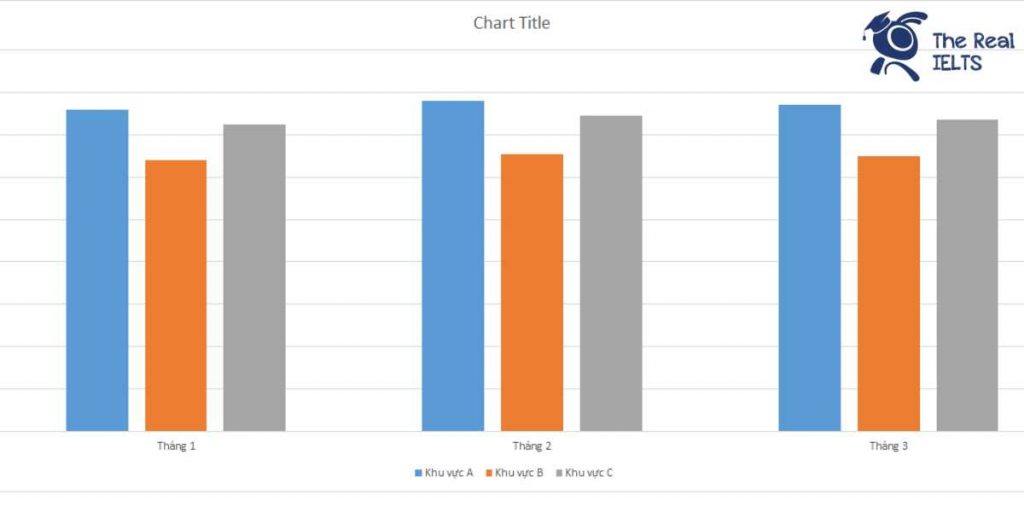

IELTS Writing Task 1 yêu cầu bạn miêu tả biểu đồ Bar Chart thể hiện tỷ lệ mắc bệnh ung thư trong ba tháng tại ba khu vực khác nhau. Bạn sẽ cần nêu rõ số liệu cụ thể, so sánh các khu vực, và xu hướng tăng giảm tỷ lệ mắc bệnh qua các tháng. Việc miêu tả chi tiết và chính xác sẽ giúp bạn đạt điểm cao trong phần thi này. Đọc bài này Cách làm bài IELTS Writing Task 1 Bar Chart trước khi làm bài. Bạn cũng có thể đọc lại bài nói về Task 1 tại đây: IELTS Writing Task 1 cần lưu ý những gì? Đọc thêm về xây dựng lộ trình học IELTS của The Real IELTS. IELTS Writing Task 1 Bar Chart: Cancer Rates You should spent about 20 mintutes on this task IELTS Writing Task 1 requires you to describe a bar chart showing cancer rates over three months in three different regions. You will need to specify the exact figures, compare the regions, and highlight the trends in the rise and fall of cancer rates over the months. Detailed and accurate descriptions will help you achieve a high score in this section. You should write at least 150 words Tháng Khu vực A Khu vực B Khu vực C Tháng 1 15.20% 12.80% 14.50% Tháng 2 15.60% 13.10% 14.90% Tháng 3 15.40% 13.00% 14.70% Bài mẫu 1 Overview This report analyzes the cancer incidence rates over a three-month period in three regions: Area A, Area B, and Area C. The data provided are hypothetical and represent the percentage of the population diagnosed with cancer each month. The aim is to compare the rates and identify any trends or notable differences between the regions over the given time frame. Body 1 Analysis of Area A In Area A, the cancer incidence rate started at 15.2% in January. It then increased slightly to 15.6% in February before decreasing marginally to 15.4% in March. The data suggest that Area A experienced minor fluctuations in its cancer incidence rate over the three months, but the overall trend remained relatively stable. The highest rate was recorded in February, indicating a peak in cancer diagnoses during this month. Analysis of Area B Area B showed a consistent but lower cancer incidence rate compared to Area A. In January, the rate was 12.8%, rising to 13.1% in February, and then decreasing slightly to 13.0% in March. Despite these minor changes, the incidence rate in Area B remained the lowest among the three areas throughout the period. This consistent pattern suggests that Area B had a relatively stable and lower risk of cancer diagnoses compared to the other regions. Body 2 Analysis of Area C In Area C, the cancer incidence rate started at 14.5% in January, increased to 14.9% in February, and then slightly decreased to 14.7% in March. The rates in Area C were generally higher than in Area B but lower than in Area A. The fluctuations in Area C’s data were minimal, indicating a steady pattern similar to the other areas but with a slightly higher overall rate compared to Area B. Comparative Analysis Comparing the three areas, Area A consistently had the highest cancer incidence rates, peaking in February. Area B had the lowest rates throughout the period, with minimal changes each month. Area C’s rates were intermediate, with small fluctuations but generally higher than Area B’s and lower than Area A’s. This comparison highlights the variation in cancer incidence across different regions and suggests that regional factors may play a role in the differences observed. In conclusion, the data indicate that while there are some fluctuations in cancer incidence rates over the three months, each area maintained a relatively stable pattern. Area A had the highest rates, Area B the lowest, and Area C fell in between, demonstrating the importance of regional analysis in understanding and addressing cancer incidence. Bài mẫu 2 Overview This report examines the incidence rates of cancer in three regions over a three-month period. The data provided outlines the percentage of cancer cases reported each month for regions A, B, and C. The aim is to compare the prevalence of cancer across these regions and observe any trends over the specified timeframe. Body 1 In January, the incidence rates of cancer varied across the three regions. Region A reported the highest rate at 15.2%, while Region B had the lowest at 12.8%. Region C’s rate was 14.5%, placing it between the other two regions. These figures indicate a noticeable disparity in cancer cases at the beginning of the period, with Region A facing the most significant challenge. Body 2 Over the next two months, the cancer rates showed slight fluctuations but remained relatively stable. In February, Region A’s incidence rate increased slightly to 15.6%, maintaining its position as the region with the highest cancer rate. Region B’s rate also rose to 13.1%, while Region C’s rate went up to 14.9%. By March, there was a minor decrease in Region A’s rate to 15.4%, and Region B saw a small drop to 13.0%. Region C experienced a slight decrease to 14.7%. Overall, Region A consistently had the highest cancer incidence, while Region B had the lowest, with Region C remaining in the middle. These observations highlight the ongoing need for targeted healthcare interventions and cancer prevention programs in these regions to address the varying rates of cancer incidence.


