Cấu Trúc “The More…The Less” sử dụng cho IELTS Writing

Trong tiếng Anh, cấu trúc “the more…the less” được sử dụng để diễn tả mối quan hệ tỉ lệ nghịch giữa hai sự việc hoặc hiện tượng. Điều này có nghĩa là khi một yếu tố tăng lên, yếu tố kia sẽ giảm xuống, hoặc ngược lại. Đây là một trong những cấu trúc ngữ pháp hữu ích để làm rõ sự tương quan đối lập giữa hai yếu tố. Cấu Trúc Và Cách Sử Dụng Cấu Trúc Cơ Bản: Sao chép mãThe more + S + V, the less + S + V Ví dụ: Ứng Dụng Thực Tế Cấu trúc “the more…the less” không chỉ được sử dụng trong văn viết mà còn phổ biến trong giao tiếp hàng ngày. Nó giúp người nói diễn tả rõ ràng mối quan hệ nghịch biến, làm cho câu chuyện trở nên logic và dễ hiểu hơn. Ví dụ Trong Giao Tiếp: Sử Dụng Trong Viết Luận Khi viết luận, đặc biệt là các bài luận học thuật hoặc bài viết SEO, việc sử dụng cấu trúc “the more…the less” giúp làm rõ quan điểm và tạo ra sự thuyết phục. Điều này đặc biệt hữu ích khi bạn cần so sánh và đối chiếu các yếu tố khác nhau. Ví dụ Trong Viết Luận: Lưu Ý Khi Sử Dụng Mặc dù cấu trúc “the more…the less” rất hữu ích, nhưng cần lưu ý cách sử dụng sao cho hợp lý và tự nhiên. Tránh việc lạm dụng cấu trúc này quá mức, vì có thể làm cho bài viết trở nên lặp đi lặp lại và mất đi sự linh hoạt. Một Số Lưu Ý: Cấu trúc “the more…the less” là một công cụ mạnh mẽ trong việc diễn tả mối quan hệ tỉ lệ nghịch giữa hai yếu tố. Việc sử dụng đúng cách cấu trúc này không chỉ giúp làm rõ ý nghĩa của câu mà còn giúp bài viết trở nên logic và thuyết phục hơn. Hãy thử áp dụng cấu trúc này vào các bài viết và cuộc trò chuyện của bạn để tạo ra những điểm nhấn ấn tượng và hiệu quả. Ứng Dụng Trong IELTS Writing Task 2 Ví dụ Đề Bài: “Some people believe that the more technology advances, the less human interaction there will be. To what extent do you agree or disagree?” Bài Viết Mẫu Sử Dụng Cấu Trúc “The More…The Less”: Introduction: In today’s fast-paced world, technology has become an integral part of our lives. Some argue that the more technology advances, the less human interaction occurs. I partially agree with this viewpoint, as while technology can indeed reduce face-to-face interactions, it also offers new ways for people to connect. Body Paragraph 1: The more people use social media platforms, the less they engage in real-life conversations. Social media allows individuals to communicate instantly with anyone worldwide, which often leads to a preference for online interactions over physical meetings. For instance, many teenagers spend hours chatting with friends on their smartphones rather than participating in outdoor activities. This trend indicates that the more reliant we become on digital communication, the less likely we are to engage in meaningful face-to-face interactions. Body Paragraph 2: However, the more advancements we see in technology, the less geographical barriers affect our communication. Modern technology, such as video conferencing tools, enables people to maintain relationships despite physical distances. For example, during the COVID-19 pandemic, many families used Zoom to stay connected, which shows that technology can also enhance human interaction by providing alternative ways to communicate when meeting in person is not possible. Conclusion: In conclusion, while it is true that the more we depend on technology, the less we may engage in traditional forms of communication, it is also essential to recognize that technological advancements can facilitate new methods of interaction. Therefore, it is crucial to strike a balance between embracing technology and maintaining face-to-face relationships. Bằng việc hiểu và vận dụng cấu trúc “the more…the less” một cách linh hoạt, bạn sẽ có thể truyền đạt ý tưởng một cách rõ ràng và thuyết phục hơn, đồng thời làm cho bài viết và lời nói của bạn trở nên hấp dẫn và cuốn hút hơn.
8 cách sử dụng thì hiện tại tiếp diễn trong IELTS Writing

Thì hiện tại tiếp diễn (Present Continuous Tense) trong tiếng Anh được sử dụng để mô tả các hành động đang diễn ra tại thời điểm nói hoặc xung quanh thời điểm nói.
IELTS Writing Task 1 Bar Chart: Car Maintenance
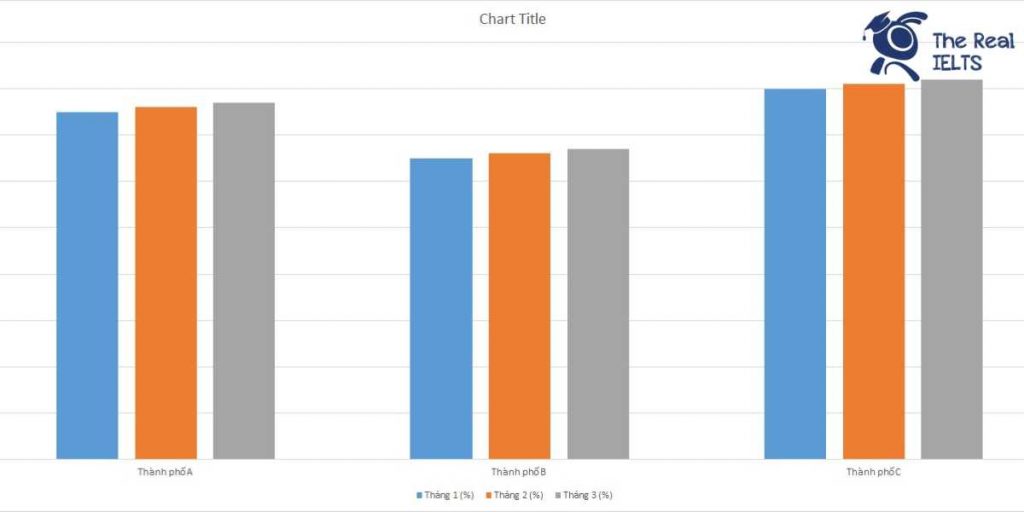

IELTS Writing Task 1 yêu cầu thí sinh phân tích biểu đồ Bar Chart về chi phí bảo dưỡng ô tô trong 3 tháng của ba gia đình. Thí sinh cần mô tả xu hướng và so sánh mức chi tiêu giữa các gia đình trong từng tháng, nhấn mạnh những điểm tương đồng và khác biệt. Việc sử dụng từ vựng chính xác và cấu trúc câu linh hoạt sẽ giúp bài viết đạt điểm cao. Đọc bài này Cách làm bài IELTS Writing Task 1 Bar Chart trước khi làm bài. Bạn cũng có thể đọc lại bài nói về Task 1 tại đây: IELTS Writing Task 1 cần lưu ý những gì? Đọc thêm về xây dựng lộ trình học IELTS của The Real IELTS. IELTS Writing Task 1 Bar Chart: Car Maintenance You should spent about 20 mintutes on this task IELTS Writing Task 1 requires candidates to analyze a Bar Chart showing the car maintenance costs over 3 months for three families. Candidates need to describe trends and compare spending levels among the families each month, highlighting similarities and differences. Using precise vocabulary and flexible sentence structures will help achieve a high score. You should write at least 150 words. Gia đình Tháng 1 (USD) Tháng 2 (USD) Tháng 3 (USD) Gia đình A 150 200 180 Gia đình B 120 160 140 Gia đình C 180 220 200 Bài mẫu 1 Overview This report provides an analysis of car maintenance costs over three months for three families: A, B, and C. The data presents monthly expenses in USD, revealing trends and comparing the financial burdens faced by each family. Body 1 Family A Family A’s maintenance costs show some fluctuation over the three months. In January, they spent $150, which increased to $200 in February, and slightly decreased to $180 in March. This suggests that while there were increased maintenance needs or perhaps higher service costs in February, they managed to reduce expenses slightly by March. The total expenditure for Family A over these three months is $530. Family B Family B’s expenses also varied, but they generally spent less compared to Family A. In January, their costs were $120, which rose to $160 in February, and then decreased to $140 in March. This pattern is similar to Family A, though their overall costs remained lower. Family B’s total maintenance costs over the three months amount to $420, making them the most economical of the three families. Body 2 Family C Family C consistently had the highest maintenance expenses among the three families. They spent $180 in January, which increased to $220 in February, and decreased slightly to $200 in March. This family saw the most significant variation in monthly costs, and their total expenses for the three months reached $600. This indicates either higher service needs or possibly more extensive maintenance being performed on their vehicle. Comparison and Conclusion Comparing the three families, Family C had the highest maintenance costs, followed by Family A, and Family B had the lowest. Family A and C had similar patterns of increased expenses in February followed by a decrease in March. Family B’s expenses were the most stable, with smaller fluctuations. This analysis highlights how different families might experience varying car maintenance costs based on usage, car condition, and maintenance practices. Bài mẫu 2 Overview The following analysis examines the car maintenance expenses for three families over a span of three months. By evaluating the provided data, we aim to understand the spending patterns and identify any significant trends in the maintenance costs for Family A, Family B, and Family C. Body 1 In the first month, the maintenance costs for Family A, Family B, and Family C were $150, $120, and $180, respectively. Family C had the highest expenditure, followed by Family A and then Family B. This initial observation suggests that Family C either encountered more maintenance issues or opted for higher quality services or parts. Body 2 In the second month, the costs increased for all three families. Family A spent $200, Family B $160, and Family C $220. Family C remained the highest spender, while Family B continued to have the lowest expenses. This upward trend in the second month indicates that maintenance costs can fluctuate significantly and may be influenced by various factors such as seasonal changes or accumulated wear and tear. Body 3 In the third month, there was a slight decrease in expenses for all families. Family A’s costs dropped to $180, Family B’s to $140, and Family C’s to $200. Despite the reduction, Family C still incurred the highest costs, and Family B maintained the lowest. This final observation highlights that while there can be monthly variations, some families consistently spend more on car maintenance, potentially due to differences in car models, usage patterns, or maintenance practices. In conclusion, the data reveals that Family C consistently had the highest car maintenance expenses over the three-month period, while Family B consistently had the lowest. Understanding these patterns can help families better budget for future maintenance costs and possibly explore ways to reduce them.
IELTS Writing Task 1 Bar Chart: Loyal Customers
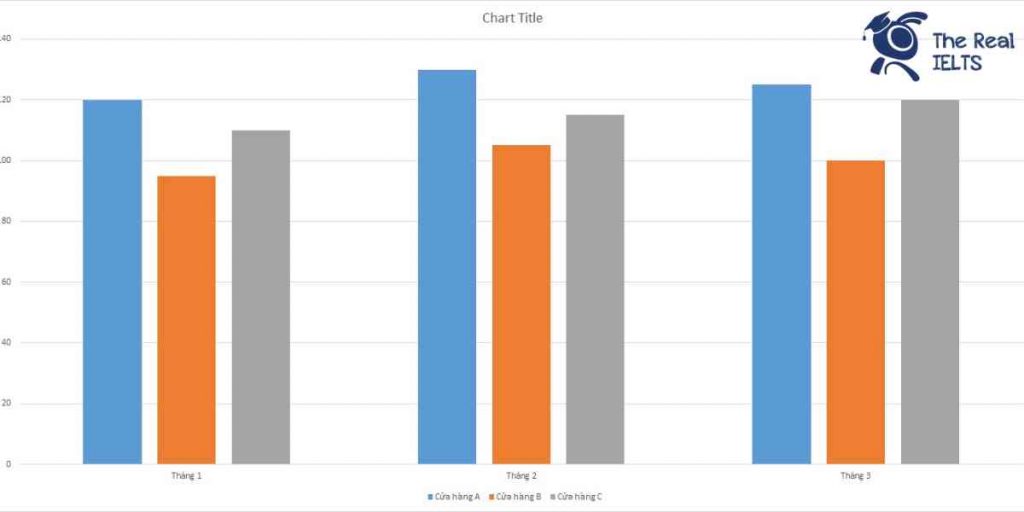

IELTS Writing Task 1 yêu cầu phân tích biểu đồ cột thể hiện số lượng khách hàng thân thiết trong 3 tháng tại 3 cửa hàng khác nhau. Biểu đồ này cung cấp dữ liệu so sánh giữa các cửa hàng và cho thấy xu hướng thay đổi qua từng tháng. Người viết cần mô tả rõ ràng sự khác biệt về số lượng khách hàng, nhận xét về sự tăng giảm và đưa ra phân tích chi tiết về dữ liệu biểu đồ. Đọc bài này Cách làm bài IELTS Writing Task 1 Bar Chart trước khi làm bài. Bạn cũng có thể đọc lại bài nói về Task 1 tại đây: IELTS Writing Task 1 cần lưu ý những gì? Đọc thêm về xây dựng lộ trình học IELTS của The Real IELTS. IELTS Writing Task 1 Bar Chart: Loyal Customers You should spent about 20 mintutes on this task IELTS Writing Task 1 requires analyzing a bar chart showing the number of loyal customers over 3 months at 3 different stores. This chart provides comparative data between the stores and shows trends over each month. The writer needs to clearly describe the differences in customer numbers, comment on the increases and decreases, and provide a detailed analysis of the chart data. You should write at least 150 words. Tháng Cửa hàng A Cửa hàng B Cửa hàng C Tháng 1 120 95 110 Tháng 2 130 105 115 Tháng 3 125 100 120 Bài mẫu 1 Overview The table presents the number of loyal customers in three different stores (A, B, and C) over a span of three months. By examining this data, we can gain insights into the performance and customer retention capabilities of each store. Body 1 In January, Store A led with 120 loyal customers, followed by Store C with 110, and Store B with 95. This initial data sets the baseline for understanding each store’s customer base. Store A’s higher numbers suggest a stronger start compared to the others. Store B, with the lowest count, indicates potential areas for improvement in customer loyalty. Body 2 The subsequent months show interesting trends. In February, all stores saw an increase in loyal customers. Store A continued to lead, increasing to 130 customers. Store B experienced a notable rise to 105, while Store C also grew to 115. By March, the dynamics shifted slightly. Store A saw a slight decrease to 125 customers, whereas Store C increased to 120, closing the gap with Store A. Store B remained consistent with a minor drop to 100. These trends suggest that while Store A remains the leader, Store C is rapidly catching up, and Store B, despite improvements, still lags behind. In summary, Store A maintains a strong customer base, Store C shows consistent growth, and Store B, though improving, needs to enhance its customer retention strategies. Bài mẫu 2 Overview The table provides a statistical overview of the number of loyal customers over a three-month period for three different stores: Store A, Store B, and Store C. The data shows the monthly changes in customer loyalty, offering insights into the performance and customer retention capabilities of each store. Body 1 In January, Store A had the highest number of loyal customers with 120, followed by Store C with 110, and Store B with 95. This initial month sets a benchmark for understanding the growth or decline in the subsequent months. By February, Store A saw an increase to 130 loyal customers, indicating a growth of 10 customers. Store B also experienced growth, albeit smaller, with an increase of 10 customers, reaching 105. Store C had a modest increase, adding 5 more customers to reach a total of 115. Body 2 March data reveals a slight decline for Store A, which dropped to 125 loyal customers, down by 5 from the previous month but still higher than January’s figure. Store B also saw a decrease, with the number of loyal customers falling to 100, a reduction of 5 from February. In contrast, Store C showed consistent growth throughout the three months, reaching 120 loyal customers in March, marking an increase of 5 from February. This trend suggests that Store C had the most consistent customer loyalty growth over the observed period. In summary, while Store A had the highest number of loyal customers overall, Store C demonstrated steady growth, and Store B experienced a slight decline after an initial increase.
IELTS Writing Task 1 Bar Chart: Excellent Students
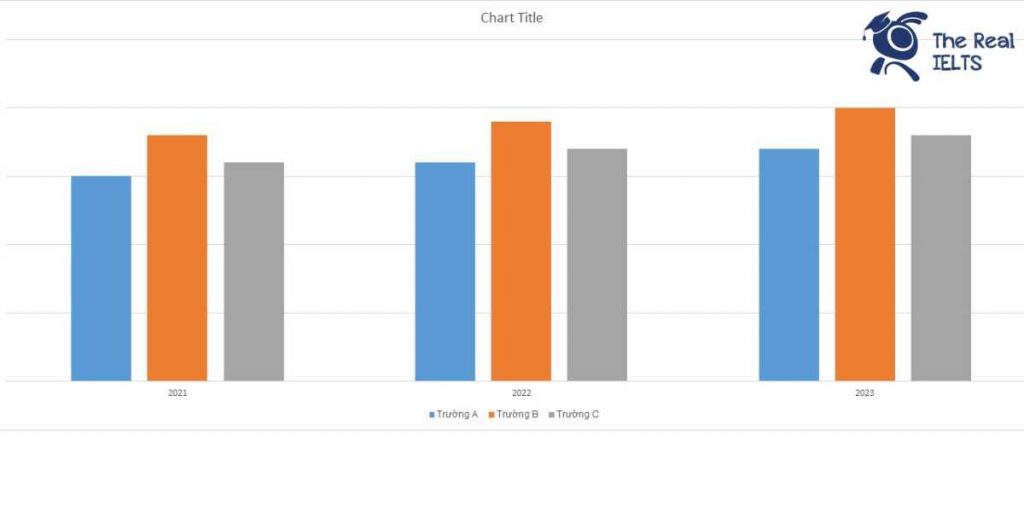

IELTS Writing Task 1 yêu cầu phân tích biểu đồ bar chart về số lượng học sinh giỏi trong ba năm tại ba trường học khác nhau.
Cấu trúc “as long as” sử dụng trong IELTS Writing

Cấu trúc “as long as” được sử dụng phổ biến trong tiếng Anh để nêu rõ điều kiện cho một hành động hoặc tình huống nào đó xảy ra.
IELTS Writing Task 1 Bar Chart: Soft Drinks
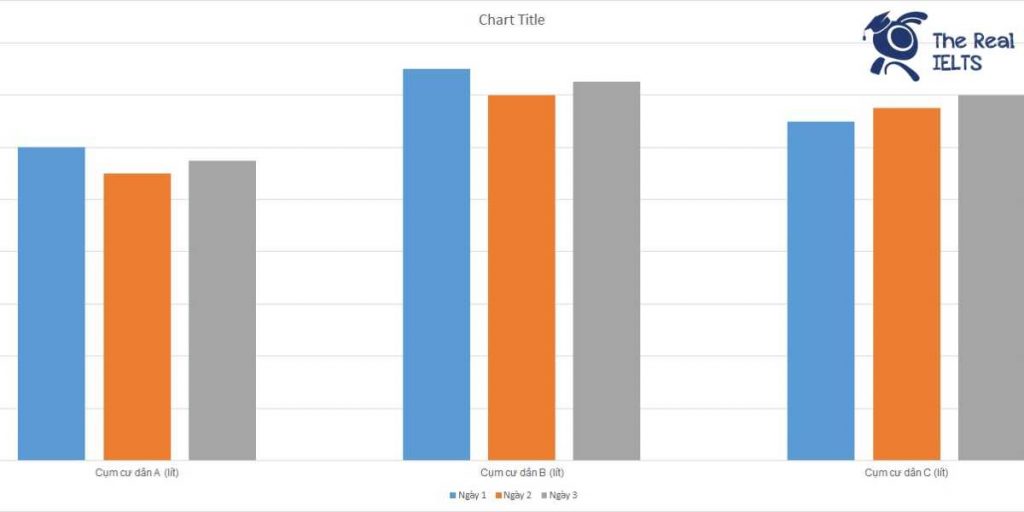

IELTS Writing Task 1 yêu cầu thí sinh mô tả biểu đồ cột về lượng tiêu thụ nước ngọt trong ba ngày của ba cụm cư dân khác nhau. Biểu đồ minh họa sự khác biệt về mức độ tiêu thụ giữa các cụm cư dân này theo từng ngày, giúp thí sinh phân tích và so sánh các số liệu. Việc nắm vững cấu trúc và ngôn ngữ mô tả biểu đồ là cần thiết để đạt điểm cao trong phần thi này. Đọc bài này Cách làm bài IELTS Writing Task 1 Bar Chart trước khi làm bài. Bạn cũng có thể đọc lại bài nói về Task 1 tại đây: IELTS Writing Task 1 cần lưu ý những gì? Đọc thêm về xây dựng lộ trình học IELTS của The Real IELTS. IELTS Writing Task 1 Bar Chart: Soft Drinks You should spent about 20 mintutes on this task IELTS Writing Task 1 requires candidates to describe a bar chart showing the consumption of soft drinks over three days by three different clusters of residents. The chart illustrates the differences in consumption levels among these clusters on each day, helping candidates analyze and compare the data. Mastering the structure and language of chart descriptions is essential to achieve a high score in this task. You should write at least 150 words. Ngày Cụm cư dân A (lít) Cụm cư dân B (lít) Cụm cư dân C (lít) Ngày 1 120 150 130 Ngày 2 110 140 135 Ngày 3 115 145 140 Bài mẫu 1 Overview The following report presents an analysis of the soft drink consumption over three days across three residential clusters: Cluster A, Cluster B, and Cluster C. The data, though hypothetical, provides insight into daily variations and overall consumption patterns within these clusters. Body 1 On Day 1, Cluster A consumed 120 liters of soft drinks, Cluster B consumed 150 liters, and Cluster C consumed 130 liters. This initial day shows that Cluster B had the highest consumption, leading by a significant margin of 30 liters compared to Cluster A, and 20 liters compared to Cluster C. This suggests that Cluster B residents had a notably higher demand for soft drinks on the first day. Body 2 Day 2 saw a slight decrease in consumption for all clusters. Cluster A consumed 110 liters, Cluster B 140 liters, and Cluster C 135 liters. The trend of Cluster B having the highest consumption continued, though the gap between Cluster B and the other clusters narrowed. On the final day, Cluster A consumed 115 liters, Cluster B 145 liters, and Cluster C 140 liters. This day showed a slight recovery in consumption, with all clusters except for Cluster A increasing their intake compared to Day 2. Cluster B remained the leading consumer, consistently showing the highest consumption across all three days. In summary, Cluster B had the highest soft drink consumption each day, followed by Cluster C, and then Cluster A. The overall pattern suggests a steady preference for soft drinks in Cluster B, with minor fluctuations in consumption across the three days. Bài mẫu 2 Overview Overall, Cluster B consistently consumed the most soft drinks over the three days, while Cluster A had the lowest consumption. The consumption pattern for all clusters showed minor fluctuations over the observed period. Body 1 On the first day, Cluster B had the highest consumption with 150 liters, followed by Cluster C with 130 liters, and Cluster A with 120 liters. On the second day, all clusters showed a decrease in consumption except for Cluster C. Cluster B again led with 140 liters, while Cluster A saw the most significant drop to 110 liters. Cluster C, however, experienced a slight increase, consuming 135 liters. Body 2 On the third day, there was a slight increase in consumption for Cluster A and Cluster B, whereas Cluster C continued its upward trend. Cluster B’s consumption rose to 145 liters, maintaining its leading position. Cluster A’s consumption increased to 115 liters, and Cluster C recorded the highest increase over the period, reaching 140 liters. Despite these fluctuations, Cluster B remained the highest consumer overall, while Cluster A consistently consumed the least.


