IELTS Writing Task 1 yêu cầu bạn mô tả biểu đồ thanh (Bar Chart) về số lượng khách hàng hủy dịch vụ trong ba tháng của ba công ty điện thoại. Biểu đồ này hiển thị số liệu cụ thể về số lượng khách hàng hủy dịch vụ hàng tháng, giúp so sánh hiệu suất của từng công ty trong khoảng thời gian này.
Đọc bài này Cách làm bài IELTS Writing Task 1 Bar Chart trước khi làm bài.
Bạn cũng có thể đọc lại bài nói về Task 1 tại đây: IELTS Writing Task 1 cần lưu ý những gì?
Đọc thêm về xây dựng lộ trình học IELTS của The Real IELTS.
IELTS Writing Task 1 Bar Chart: Customers Cancel
You should spent about 20 mintutes on this task
IELTS Writing Task 1 requires you to describe a bar chart showing the number of customers who canceled their service over three months for three phone companies. This chart provides specific data on the monthly cancellation numbers, helping to compare the performance of each company during this period.
You should write at least 150 words
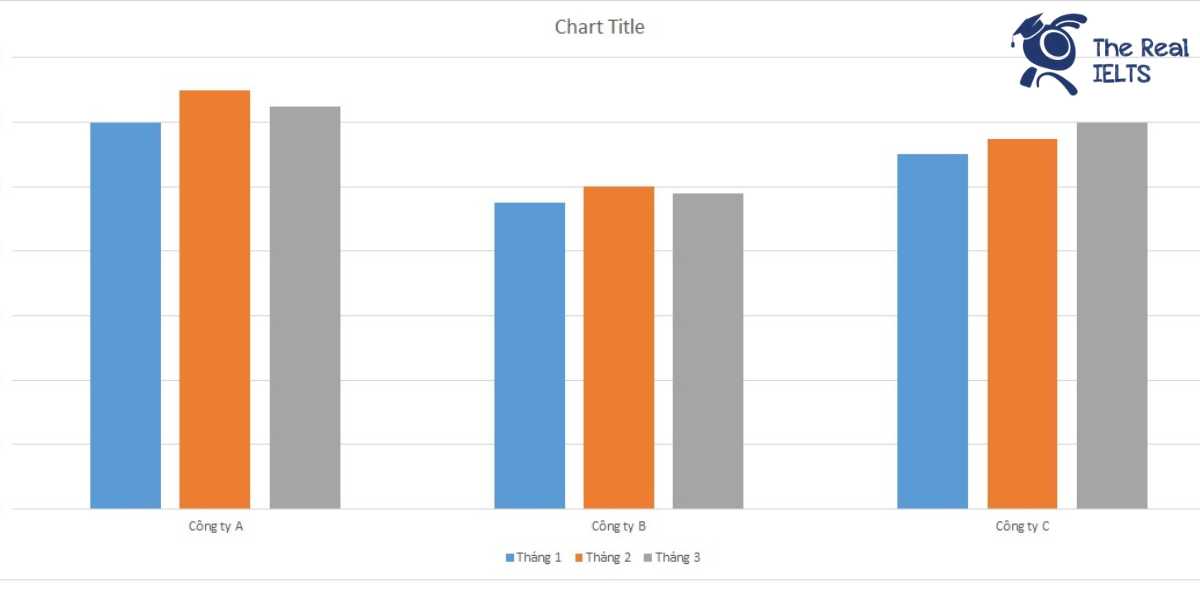
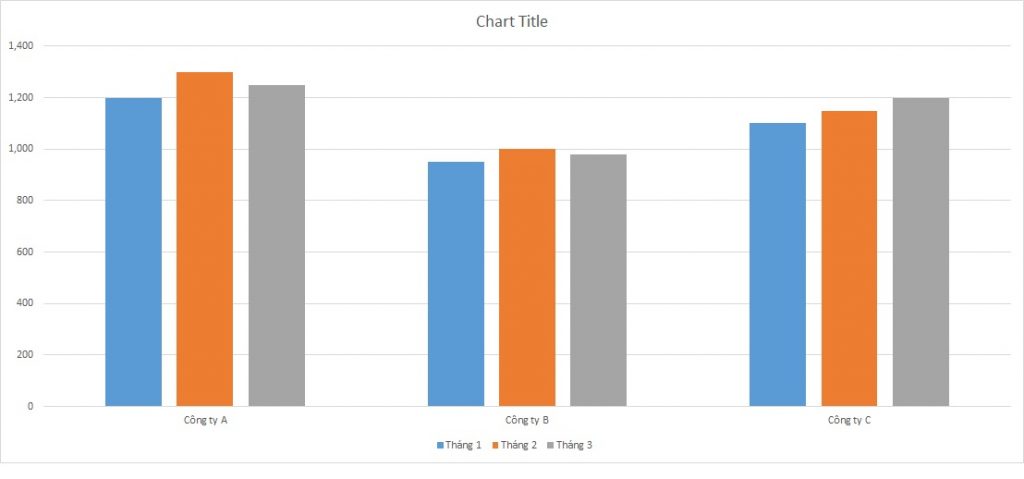
| Tháng | Công ty A | Công ty B | Công ty C |
| Tháng 1 | 1,200 | 950,000 | 1,100 |
| Tháng 2 | 1,300 | 1,000 | 1,150 |
| Tháng 3 | 1,250 | 980,000 | 1,200 |
Bài mẫu 1
Introduction: The table provides data on the number of service cancellations over three months (January, February, and March) for three different phone companies: Company A, Company B, and Company C.
Overview: Overall, Company A experienced the highest number of cancellations each month, while Company B had the lowest. Although fluctuations occurred in the number of cancellations, all three companies saw an increase in cancellations by March compared to January.
Body 1: In January, Company A had 1,200 cancellations, which was the highest among the three companies. Company B had the fewest cancellations at 950, and Company C had 1,100 cancellations. Moving to February, all companies saw an increase in cancellations. Company A’s cancellations rose to 1,300, Company B to 1,000, and Company C to 1,150.
Body 2: By March, the number of cancellations decreased slightly for Company A to 1,250 and for Company B to 980. However, Company C experienced an increase, reaching 1,200 cancellations, which was the highest for that month among the three companies. Despite the fluctuations, Company B consistently had the fewest cancellations, while Company A remained the company with the most cancellations over the three months.
Bài mẫu 2
Introduction
The table illustrates the number of customers who canceled their services from three different telephone companies (Company A, Company B, and Company C) over a three-month period.
Overview
Overall, the data indicates that all three companies experienced a fluctuating number of cancellations throughout the three months, with Company A consistently having the highest number of cancellations and Company B the lowest.
Body 1
In January, Company A had the highest number of cancellations at 1,200, followed closely by Company C with 1,100 cancellations. Company B had the least number of cancellations at 950. In February, the number of cancellations increased for all three companies. Company A saw a rise to 1,300 cancellations, while Company C’s cancellations increased to 1,150. Company B also experienced a slight increase to 1,000 cancellations.
Body 2
In March, the trend shifted slightly. Company A’s cancellations decreased to 1,250, while Company B saw a minor decrease to 980. In contrast, Company C’s cancellations rose to 1,200, marking the highest number of cancellations for this company over the three months. Despite the fluctuations, Company A remained the company with the highest number of cancellations each month, while Company B consistently had the lowest number.
Conclusion
In summary, the number of customer cancellations varied for all three companies, with Company A consistently having the highest cancellations and Company B the lowest. The data suggests that while cancellations fluctuated month to month, each company experienced different trends in their customer retention over the three-month period.