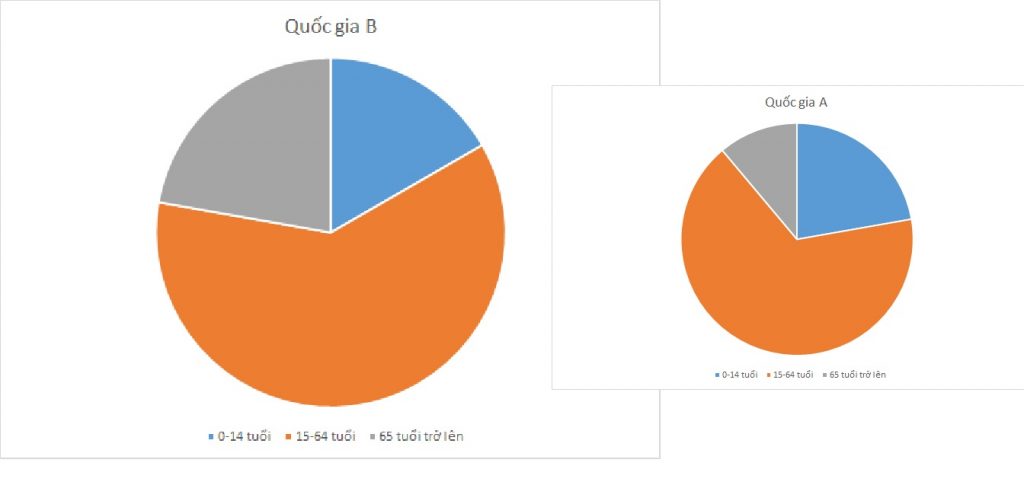
IELTS Writing Task 1 yêu cầu bạn miêu tả biểu đồ Pie Chart về phân bố dân số theo ba độ tuổi tại hai quốc gia. Biểu đồ này chia dân số thành ba nhóm: trẻ em, người trưởng thành và người già. Nhiệm vụ của bạn là so sánh và đối chiếu tỉ lệ phần trăm của từng nhóm tuổi giữa hai quốc gia, chỉ ra những điểm tương đồng và khác biệt quan trọng.
Đọc thêm về Luyện thi IELTS như thế nào?
Đọc thêm về Cách làm IELTS Writing Task 1 PIE chart.
IELTS Writing Task 1 PIE Chart: Population
You should spent about 20 mintutes on this task
IELTS Writing Task 1 requires you to describe a Pie Chart showing the population distribution by three age groups in two countries. The chart divides the population into three groups: children, adults, and the elderly. Your task is to compare and contrast the percentage of each age group between the two countries, highlighting significant similarities and differences.
You should write at least 150 words.
| Quốc gia | 0-14 tuổi | 15-64 tuổi | 65 tuổi trở lên |
| Quốc gia A | 20,000,000 | 60,000,000 | 10,000,000 |
| Quốc gia B | 15,000,000 | 55,000,000 | 20,000,000 |


Bài mẫu 1
Overview
This report presents the population distribution by age groups in two hypothetical countries, Country A and Country B. The age groups are categorized as 0-14 years, 15-64 years, and 65 years and older. The data provided helps illustrate the demographic structure and potential social and economic implications for these countries. Pie charts will be used to visualize the population distribution across these age groups for each country.
Body 1: Country A Population Distribution
Country A has a total population of 90 million people. The age group distribution is as follows:
- 0-14 years: 20 million
- 15-64 years: 60 million
- 65 years and older: 10 million
The majority of Country A’s population falls within the 15-64 age group, comprising 66.7% of the total population. The 0-14 age group makes up 22.2%, while the 65 and older group accounts for 11.1%. This distribution indicates a relatively youthful population with a strong working-age demographic, which could imply potential for economic growth and a lower dependency ratio.
Body 2: Country B Population Distribution
Country B has a total population of 90 million people, similar to Country A. The age group distribution is as follows:
- 0-14 years: 15 million
- 15-64 years: 55 million
- 65 years and older: 20 million
In Country B, the 15-64 age group also makes up the largest portion of the population at 61.1%. The 0-14 age group constitutes 16.7%, and the 65 and older group represents 22.2% of the population. This distribution suggests a more aged population compared to Country A, with a higher proportion of elderly individuals. This demographic structure may lead to increased social and economic pressures related to healthcare, pensions, and elder care services.
The pie charts below will help visualize the population distribution in both countries, highlighting the differences in demographic structure.
Bài mẫu 2
Overview
The population distribution in two hypothetical countries, Country A and Country B, is categorized into three age groups: 0-14 years, 15-64 years, and 65 years and above. This data provides insights into the demographic structure, highlighting differences in the proportion of the youth, working-age population, and elderly citizens in each country.
Body 1
In Country A, the population is predominantly in the working-age group (15-64 years), which comprises 60,000,000 people or 66.7% of the total population. The youth population (0-14 years) stands at 20,000,000, representing 22.2% of the total, while the elderly population (65 years and above) is 10,000,000, accounting for 11.1%. This distribution indicates a relatively young population, with a significant proportion of individuals in their most economically productive years.
Body 2
Country B exhibits a different demographic structure. The working-age group is also the largest, with 55,000,000 people, making up 61.1% of the total population. The youth population is smaller compared to Country A, with 15,000,000 individuals or 16.7%. Notably, the elderly population in Country B is double that of Country A, comprising 20,000,000 people or 22.2% of the total population. This indicates an aging population, which could have implications for healthcare, pensions, and the labor market.
In summary, Country A has a younger population with a larger proportion of individuals in the working-age group, while Country B has a significant elderly population, which may present different social and economic challenges.


