IELTS Writing Task 1 yêu cầu bạn mô tả một biểu đồ hình tròn (pie chart) thể hiện tỷ lệ sử dụng ba loại phương tiện giao thông ở hai thành phố khác nhau. Bạn cần so sánh sự khác biệt và tương đồng giữa các thành phố trong việc sử dụng ô tô, xe buýt và xe đạp, đồng thời nêu rõ sự thay đổi tỷ lệ của từng phương tiện.
Đọc thêm về Luyện thi IELTS như thế nào?
Đọc thêm về Cách làm IELTS Writing Task 1 PIE chart.
IELTS Writing Task 1 PIE Chart: Transportation
You should spent about 20 mintutes on this task
In IELTS Writing Task 1, you are required to describe a pie chart showing the proportion of three types of transportation used in two different cities. You need to compare the differences and similarities between the cities in terms of car, bus, and bicycle usage, while also highlighting the changes in the proportion of each mode of transportation.
You should write at least 150 words.
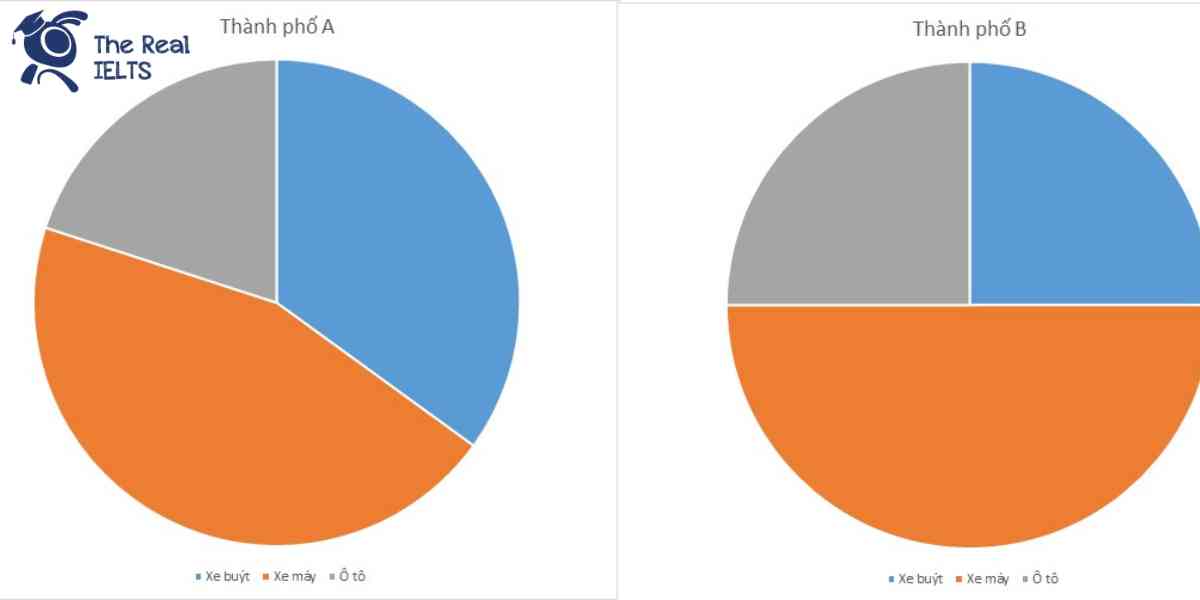
| Thành phố A | |
| Xe buýt | 35 |
| Xe máy | 45 |
| Ô tô | 20 |
| Thành phố B | |
| Xe buýt | 25 |
| Xe máy | 50 |
| Ô tô | 25 |

Bài mẫu số 1
Overview
This report presents the usage statistics of three types of transportation (bus, motorcycle, car) in two different cities, referred to as City A and City B. The data is represented in percentages, and it highlights the preference patterns among the residents of these cities.
Body 1
In City A, the distribution of transportation usage is as follows:
- Bus: 35%
- Motorcycle: 45%
- Car: 20%
From these figures, it is evident that motorcycles are the most popular mode of transportation, accounting for nearly half of the total usage. Buses follow with a significant 35%, suggesting a strong public transport system. Cars are the least used, with only 20% of the residents opting for this mode.
Body 2
In City B, the statistics show a slightly different trend:
- Bus: 25%
- Motorcycle: 50%
- Car: 25%
Motorcycles dominate the transportation landscape even more in City B, with exactly half of the residents using them. The use of buses and cars is evenly split, each accounting for 25%. This indicates a balanced preference between public transport and private cars, though motorcycles still lead by a substantial margin.
These statistics are visually represented in the following pie charts for a clearer comparison between the two cities.
Bài mẫu số 2
Overview
The following analysis examines the usage percentages of three types of transportation—buses, motorcycles, and cars—in two hypothetical cities, referred to as City A and City B. The data provide a comparative view of the transportation preferences among residents in these cities.
Body 1: Transportation in City A
In City A, the use of public and private transportation shows a distinct pattern. Motorcycles are the most popular, with 45% of the population opting for this mode of travel. This preference might be attributed to motorcycles being more convenient for navigating urban traffic and possibly more cost-effective. Buses are the second most common mode of transport, utilized by 35% of the population. This suggests a significant reliance on public transportation, possibly due to affordability or efficient bus networks. Cars are the least used, with only 20% of the population choosing this option, which could be due to higher costs associated with owning and maintaining a vehicle, or perhaps due to traffic congestion and limited parking spaces in the city.
Body 2: Transportation in City B
City B exhibits different transportation preferences. Motorcycles are also the most popular here, but their usage is even higher, with 50% of the population relying on them. This could indicate similar factors as in City A, such as cost-efficiency and ease of use in traffic. The usage of buses is lower in City B, at 25%, suggesting that the bus system may not be as extensive or that people prefer the flexibility of motorcycles. Interestingly, the use of cars is notably higher in City B compared to City A, with 25% of the population using cars. This could be due to better infrastructure, more parking availability, or a higher income level among residents, allowing for greater car ownership.
Overall, the data highlight varying preferences in transportation modes between the two cities, potentially reflecting differences in infrastructure, economic factors, and urban planning.