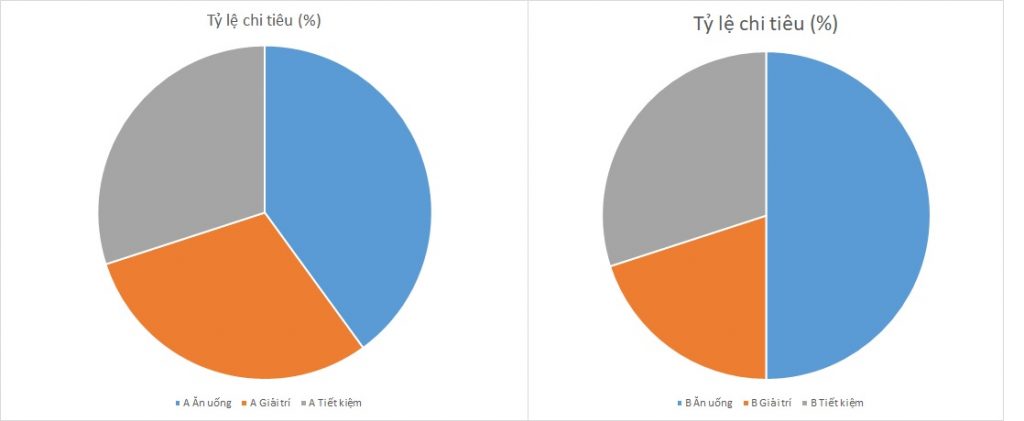
IELTS Writing Task 1 yêu cầu bạn phân tích và mô tả một biểu đồ dạng PIE Chart. Trong bài này, bạn sẽ so sánh tỷ lệ chi tiêu hàng năm cho ba mục của hai hộ gia đình. Cần chú ý đến sự khác biệt và tương đồng trong tỷ lệ phần trăm của các mục chi tiêu giữa hai hộ gia đình để đưa ra một cái nhìn tổng quan và chính xác về sự phân bổ ngân sách.
Đọc thêm về Luyện thi IELTS như thế nào?
Đọc thêm về Cách làm IELTS Writing Task 1 PIE chart.
IELTS Writing Task 1 PIE Chart: Two Households
You should spent about 20 mintutes on this task
IELTS Writing Task 1 requires you to analyze and describe a pie chart. In this task, you will compare the annual expenditure percentages for three categories between two households. Pay attention to the differences and similarities in the expenditure percentages for each category between the households to provide a clear and accurate overview of the budget allocation.
You should write at least 150 words.
| Hộ gia đình | Mục chi tiêu | Tỷ lệ chi tiêu (%) |
| A | Ăn uống | 40 |
| A | Giải trí | 30 |
| A | Tiết kiệm | 30 |
| B | Ăn uống | 50 |
| B | Giải trí | 20 |
| B | Tiết kiệm | 30 |


Bài mẫu 1
Overview
This report examines the annual spending distribution of two households, Household A and Household B, across three categories: Food, Entertainment, and Savings. The percentages of expenditures in each category provide insight into the financial priorities and habits of both households. The data is presented in a pie chart format to facilitate easy comparison and understanding of the differences and similarities in their spending patterns.
Body 1: Household A
Household A allocates its annual budget into three main categories:
- Food: 40%
- Entertainment: 30%
- Savings: 30%
From the data, it is clear that Household A spends the largest portion of its budget on Food, accounting for 40%. This indicates a significant emphasis on food-related expenses, which could include groceries, dining out, and other food-related activities. Both Entertainment and Savings share equal importance, each taking up 30% of the household’s budget. This balance suggests that Household A values leisure activities and future financial security equally.
Body 2: Household B
Household B, on the other hand, shows a different spending pattern:
- Food: 50%
- Entertainment: 20%
- Savings: 30%
For Household B, Food expenses are even more dominant, with half of the total budget allocated to this category. This higher percentage could indicate a larger family size or a preference for higher quality or more frequent food expenditures. Entertainment takes up a smaller portion, at 20%, reflecting a lower priority compared to Household A. However, similar to Household A, Savings still constitute 30% of the budget, indicating a consistent value placed on financial security across both households.
Conclusion
The comparative analysis of Household A and Household B reveals distinct spending priorities, with Household B spending more on Food and less on Entertainment than Household A. Despite these differences, both households allocate an equal percentage of their budget to Savings, highlighting a common focus on maintaining financial stability.
Bài mẫu số 2
Overview
This analysis examines the annual expenditure distribution of two households, A and B, across three main categories: Food, Entertainment, and Savings. The data is presented in percentage terms, offering a comparative insight into the spending habits and priorities of these households.
Body 1
For Household A, the expenditure is evenly distributed across the categories of Food, Entertainment, and Savings, with Food receiving a slightly larger share. Specifically, Household A allocates 40% of its annual spending to Food, indicating a strong emphasis on daily living necessities. Both Entertainment and Savings each account for 30% of the total expenditure. This balanced distribution suggests that Household A values both leisure activities and financial security, while still prioritizing essential needs.
Body 2
Household B, on the other hand, shows a different spending pattern. A significant portion of its budget, 50%, is allocated to Food, which may indicate a higher emphasis on culinary needs or a larger family size. Entertainment receives a smaller share of 20%, possibly reflecting a preference for fewer leisure activities or a tighter budget. Similar to Household A, Household B also assigns 30% of its spending to Savings, highlighting a comparable commitment to financial prudence. The differences in expenditure distribution between the two households suggest varying priorities and lifestyle choices, particularly in how much is spent on Food and Entertainment.
Overall, these spending patterns provide valuable insights into the financial behaviors and priorities of the two households, illustrating how different households might allocate their resources based on their unique circumstances and values.


