IELTS Writing Task 1 yêu cầu bạn miêu tả biểu đồ Bar Chart về tỷ lệ hoàn thành công việc theo tháng trong năm 2021. Biểu đồ này cung cấp dữ liệu về mức độ hoàn thành công việc trong từng tháng, cho thấy xu hướng biến đổi và sự khác biệt trong năng suất làm việc qua các giai đoạn của năm.
Đọc bài này Cách làm bài IELTS Writing Task 1 Bar Chart trước khi làm bài.
Bạn cũng có thể đọc lại bài nói về Task 1 tại đây: IELTS Writing Task 1 cần lưu ý những gì?
IELTS Writing Task 1 Bar Chart: Completion Rates
You should spent about 20 mintutes on this task
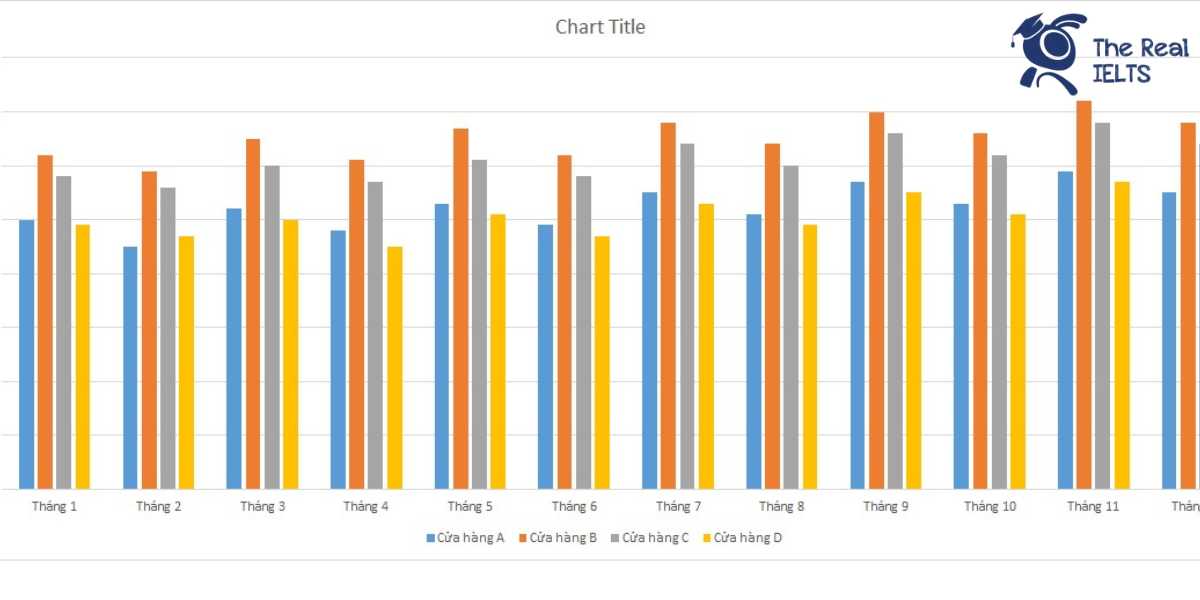
IELTS Writing Task 1 requires you to describe a Bar Chart depicting the completion rates of tasks per month in 2021. This chart provides data on the level of task completion each month, illustrating trends and variations in productivity throughout the year.
You should write at least 150 words.
| Tháng | Phòng ban A | Phòng ban B | Phòng ban C | Phòng ban D |
| Tháng 1 | 85% | 90% | 78% | 92% |
| Tháng 2 | 88% | 85% | 80% | 89% |
| Tháng 3 | 90% | 87% | 82% | 91% |
| Tháng 4 | 87% | 89% | 84% | 93% |
| Tháng 5 | 86% | 88% | 83% | 90% |
| Tháng 6 | 88% | 90% | 85% | 92% |
| Tháng 7 | 89% | 91% | 86% | 93% |
| Tháng 8 | 90% | 92% | 87% | 94% |
| Tháng 9 | 91% | 93% | 88% | 95% |
| Tháng 10 | 89% | 91% | 86% | 93% |
| Tháng 11 | 88% | 90% | 85% | 92% |
| Tháng 12 | 90% | 92% | 87% | 94% |
Bài mẫu:
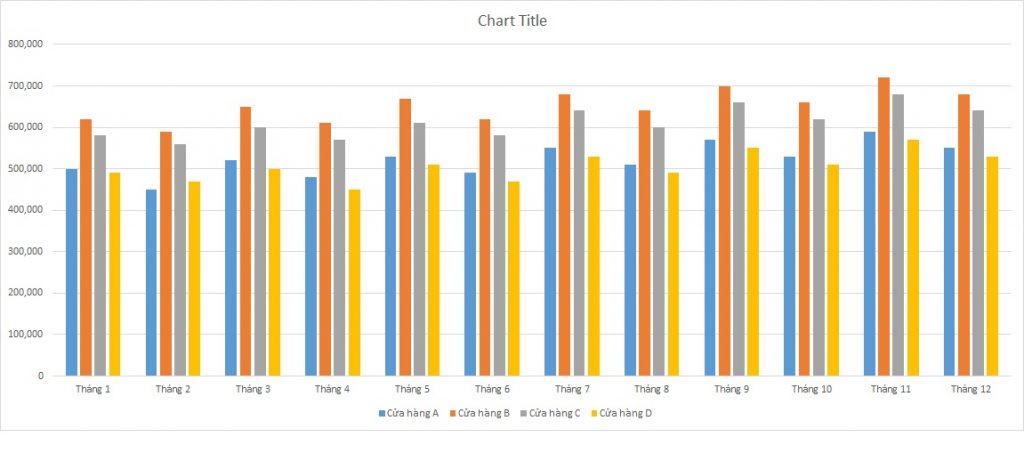
Introduction: The table illustrates the percentage of task completion each month for the year 2021 across four different departments: A, B, C, and D.
Overview: Overall, it can be observed that Department D consistently achieved the highest completion rates throughout the year, while Department C had the lowest. Departments A and B showed relatively stable and high completion rates, with B slightly outperforming A in most months.
Body 1: In the first half of the year, Department D maintained a high completion rate, starting at 92% in January and ending at 92% in June, peaking at 93% in April. Department A started at 85% in January and increased to 88% in both February and June. Department B had a strong start with 90% in January, fluctuating slightly but ending at 90% in June. Meanwhile, Department C started at 78% in January and showed a gradual increase, reaching 85% by June.
Body 2: In the latter half of the year, Department D continued to lead with completion rates ranging from 93% to 95%, peaking in September. Department A showed a slight increase, peaking at 91% in September. Department B remained stable, consistently achieving around 90% to 93%. Department C, although the lowest among the four, showed improvement, peaking at 88% in September and maintaining 87% in the final month of December.
Overall, Department D was the top performer, and while Department C had the lowest rates, it showed notable improvement over the year. Departments A and B maintained high and stable completion rates throughout 2021.