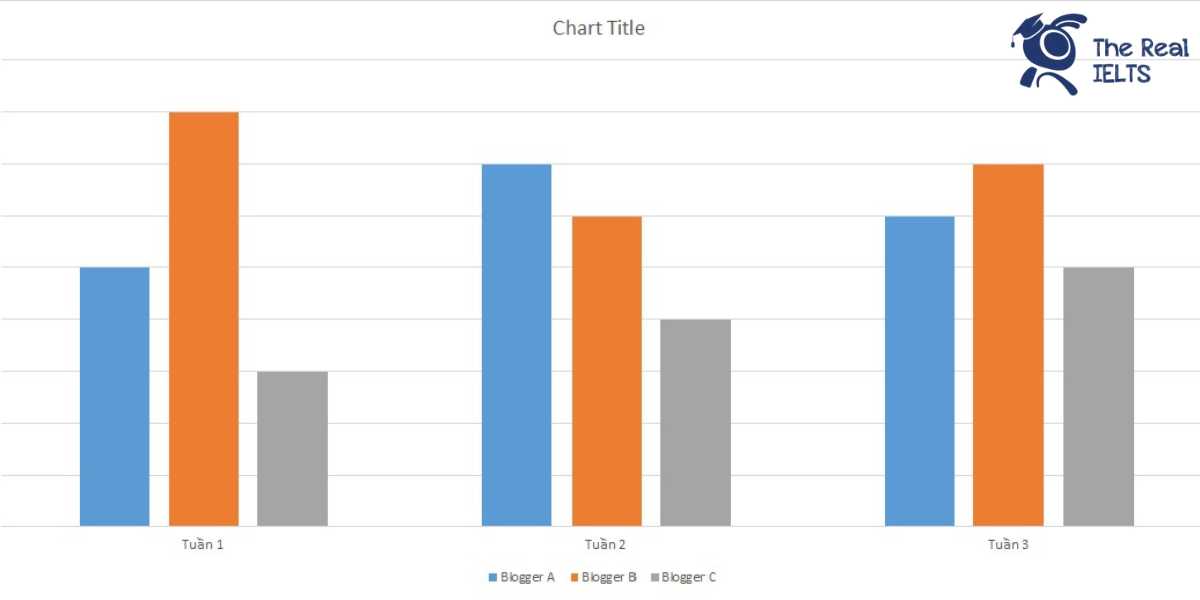
IELTS Writing Task 1 yêu cầu mô tả Bar Chart về số lượng bài viết blog của ba blogger khác nhau trong ba tuần. Biểu đồ minh họa sự khác biệt về số lượng bài viết của từng blogger qua từng tuần, từ đó giúp đánh giá hiệu suất và hoạt động của mỗi người trong khoảng thời gian cụ thể.
Đọc bài này Cách làm bài IELTS Writing Task 1 Bar Chart trước khi làm bài.
Bạn cũng có thể đọc lại bài nói về Task 1 tại đây: IELTS Writing Task 1 cần lưu ý những gì?
IELTS Writing Task 1 Bar Chart: Blog Posts
You should spent about 20 mintutes on this task
IELTS Writing Task 1 requires describing a Bar Chart showing the number of blog posts by three different bloggers over three weeks. The chart illustrates the differences in the number of posts by each blogger per week, helping to assess each person’s performance and activity during the specified period.
You should write at least 150 words.
Bài mẫu 1
Introduction
The table illustrates the number of blog posts written by three different bloggers (A, B, and C) over a period of three weeks.
Overview
Overall, Blogger B consistently produced the highest number of blog posts each week, while Blogger C had the lowest output. The number of posts for each blogger varied from week to week, with no single blogger consistently increasing or decreasing their output.
Body 1
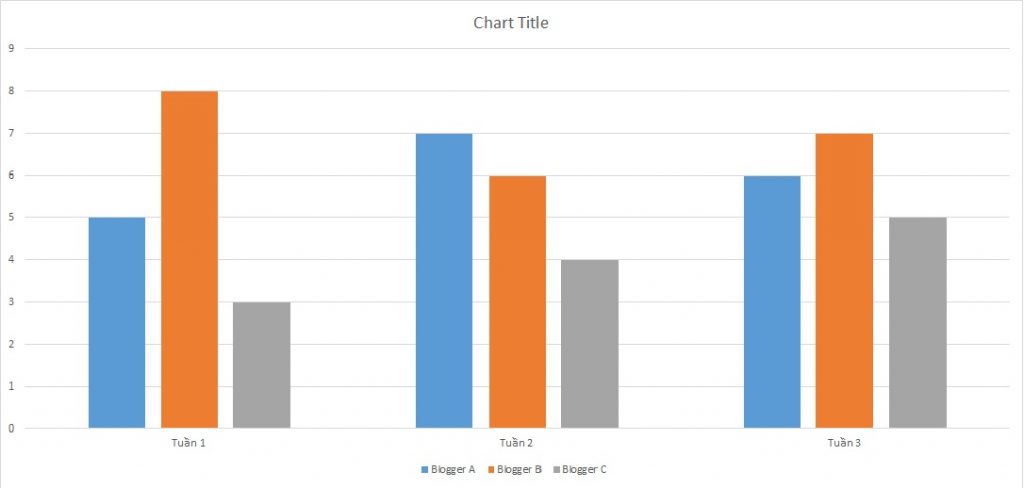
In the first week, Blogger A wrote 5 posts, which was less than Blogger B’s 8 posts but more than Blogger C’s 3 posts. In the second week, Blogger A increased their output to 7 posts, surpassing Blogger B’s 6 posts and more than doubling Blogger C’s 4 posts.
Body 2
During the third week, Blogger A’s output decreased slightly to 6 posts, whereas Blogger B increased their count to 7 posts. Blogger C also showed a gradual increase in their output, reaching 5 posts. This week marked the highest productivity for both Bloggers B and C. Despite the fluctuations, Blogger B maintained the highest total number of posts across the three weeks.
Bài mẫu 2
Introduction:
The table provides information on the number of blog posts written by three different bloggers, labeled A, B, and C, over a period of three weeks.
Overview:
Overall, Blogger A produced the most blog posts in total, while Blogger C consistently wrote the fewest. Blogger B’s output fluctuated, peaking in the first week but dropping slightly in the following weeks.
Body 1:
In the first week, Blogger B led the group with 8 blog posts, followed by Blogger A with 5 posts, and Blogger C with the fewest at 3 posts. During the second week, Blogger A increased their output to 7 posts, surpassing Blogger B who produced 6 posts. Blogger C also showed a slight increase, writing 4 posts.
Body 2:
By the third week, Blogger B and Blogger C both demonstrated increased productivity, with Blogger B writing 7 posts and Blogger C writing 5 posts. However, Blogger A’s output decreased slightly to 6 posts. Over the three weeks, Blogger A wrote a total of 18 posts, Blogger B 21 posts, and Blogger C 12 posts.
In summary, Blogger A maintained a relatively high and stable level of output, Blogger B had a strong start but a minor dip in the second week, and Blogger C gradually increased their productivity over the three-week period.
Bài mẫu 3
Introduction
The table presents the number of blog posts written by three bloggers, A, B, and C, over a span of three weeks.
Overview
Overall, the data reveals that Blogger B consistently produced the highest number of blog posts each week, whereas Blogger C wrote the least. Additionally, while Blogger A showed some fluctuation in their posting frequency, their output remained relatively steady.
Body 1
In the first week, Blogger B led with 8 blog posts, followed by Blogger A with 5, and Blogger C with 3. During the second week, Blogger A increased their output to 7 posts, while Blogger B’s contributions decreased slightly to 6. Blogger C wrote one more post compared to the first week, reaching a total of 4.
Body 2
In the third week, Blogger B regained their lead with 7 posts, marking a slight improvement from the previous week. Blogger A wrote 6 posts, showing a slight decrease from their peak in the second week. Meanwhile, Blogger C continued their gradual increase in output, posting 5 blogs.
Conclusion
In summary, Blogger B consistently produced the most content, despite a slight drop in the second week, while Blogger C showed a steady increase in their posting frequency over the three weeks. Blogger A’s contributions varied but remained within a close range.
Bài mẫu 4
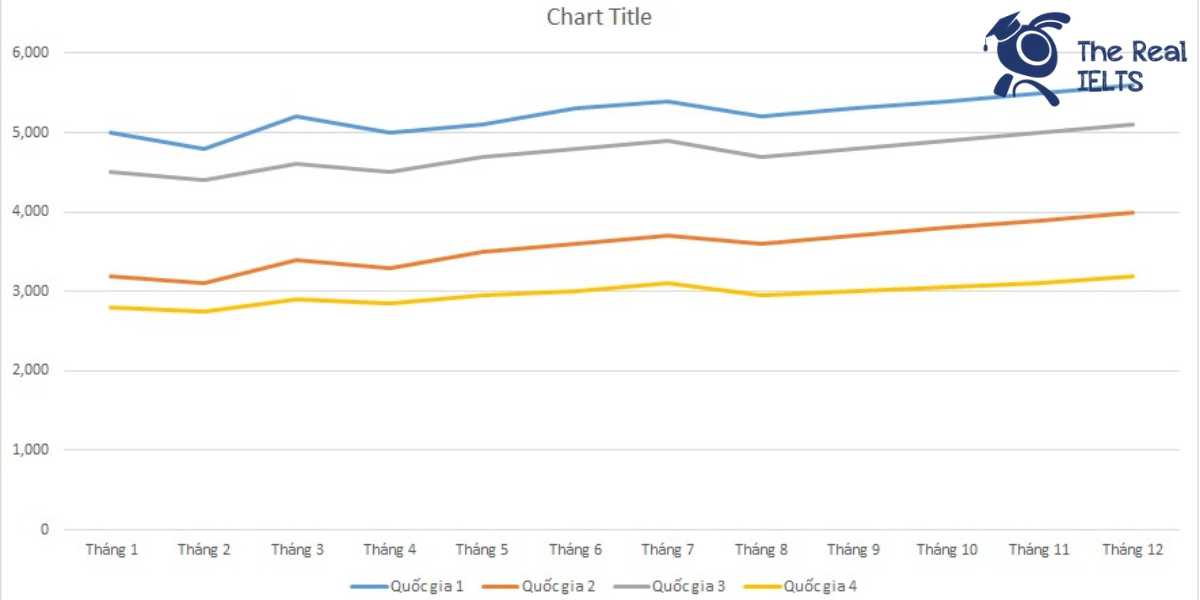
The table illustrates the average annual rainfall (in millimeters) in four cities—City A, City B, City C, and City D—from 2011 to 2013.
Overall, City A consistently received the highest rainfall over the three-year period, while City B had the lowest. All cities showed fluctuations in rainfall, with most cities experiencing an increase in 2012 before a slight decline in 2013.
In detail, City A had the highest rainfall each year, with 1200 mm in 2011, peaking at 1250 mm in 2012, and then dropping to 1180 mm in 2013. City B consistently recorded the lowest rainfall, starting at 850 mm in 2011, increasing to 870 mm in 2012, and reaching 900 mm in 2013.
City C’s rainfall figures were relatively stable, beginning at 950 mm in 2011, rising to 980 mm in 2012, and slightly decreasing to 970 mm in 2013. City D experienced a steady increase from 1100 mm in 2011 to 1150 mm in 2012, followed by a minor reduction to 1130 mm in 2013.
In conclusion, while City A had the highest rainfall and City B the lowest, all cities showed similar trends of increased rainfall in 2012 followed by a small decrease in 2013.
Bài mẫu 5
Introduction
The table illustrates the number of blog posts written by three different bloggers, A, B, and C, over a period of three weeks.
Overview
Overall, Blogger A consistently increased their output over the three weeks, while Blogger B showed a slight fluctuation in their posting frequency. Blogger C had the lowest number of posts each week but demonstrated a steady increase in their productivity.
Body 1
In the first week, Blogger B was the most productive, writing 8 posts, followed by Blogger A with 5 posts, and Blogger C with 3 posts. In the second week, Blogger A increased their output to 7 posts, surpassing Blogger B, who wrote 6 posts. Blogger C also increased their number of posts to 4.
Body 2
By the third week, Blogger B regained the lead with 7 posts, although this was just one post higher than Blogger A’s 6 posts. Blogger C continued their gradual increase, producing 5 posts. This steady rise for Blogger C suggests a growing consistency in their blogging activity over the three weeks.