IELTS Writing Task 1 yêu cầu mô tả biểu đồ cột thể hiện số lượng khách hàng mới trong ba tháng tại ba thành phố khác nhau. Biểu đồ này cung cấp thông tin cụ thể về sự biến động trong lượng khách hàng mới tại mỗi thành phố, giúp người đọc so sánh và đánh giá hiệu quả kinh doanh theo từng khu vực.
Đọc bài này Cách làm bài IELTS Writing Task 1 Bar Chart trước khi làm bài.
Bạn cũng có thể đọc lại bài nói về Task 1 tại đây: IELTS Writing Task 1 cần lưu ý những gì?
IELTS Writing Task 1 Bar Chart: New Customers
You should spent about 20 mintutes on this task
IELTS Writing Task 1 requires describing a bar chart that shows the number of new customers over three months in three different cities. This chart provides specific information on the fluctuations in the number of new customers in each city, helping readers compare and assess business performance in each area.
You should write at least 150 words.
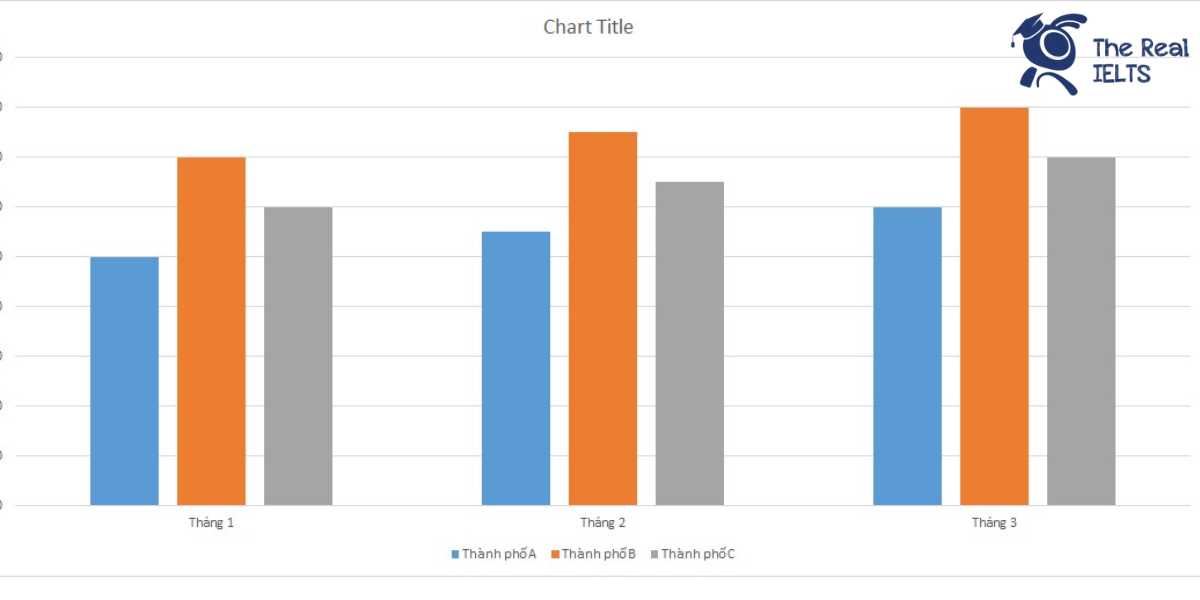
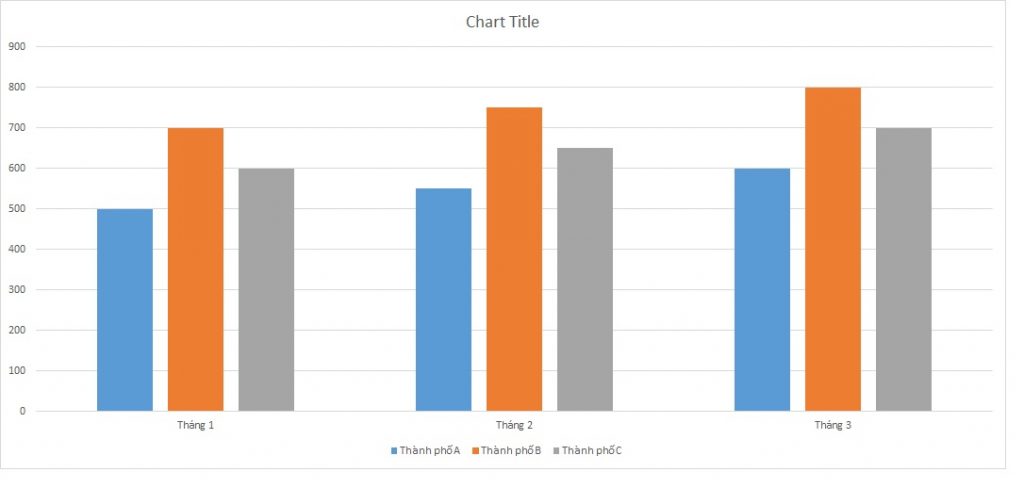
| Tháng | Thành phố A | Thành phố B | Thành phố C |
| Tháng 1 | 500 | 700 | 600 |
| Tháng 2 | 550 | 750 | 650 |
| Tháng 3 | 600 | 800 | 700 |
Bài mẫu 1
Introduction
The table illustrates the number of new customers in three different cities (City A, City B, and City C) over a three-month period.
Overview
Overall, the number of new customers increased consistently across all three cities from January to March. City B consistently had the highest number of new customers each month, while City A had the lowest.
Body 1
In January, City A had 500 new customers, City B had 700, and City C had 600. In February, the number of new customers rose to 550 in City A, 750 in City B, and 650 in City C. This shows a noticeable upward trend in all cities.
Body 2
By March, the number of new customers had further increased to 600 in City A, 800 in City B, and 700 in City C. This data indicates that City B experienced the largest growth in new customers, increasing by 100 each month. City C had a steady increase of 50 new customers per month, while City A showed a gradual increase of 50 new customers each month.
In conclusion, all three cities saw a consistent rise in new customers over the three-month period, with City B leading in the highest number of new customers each month.
Bài mẫu 2
Introduction
The table provides data on the number of new customers in three different cities—City A, City B, and City C—over a period of three months (January, February, and March).
Overview
Overall, the number of new customers increased steadily in all three cities throughout the three-month period. City B consistently had the highest number of new customers each month, followed by City C and then City A.
Body 1
In January, City A had 500 new customers, which was the lowest among the three cities. City B led with 700 new customers, and City C was in the middle with 600. In February, all cities experienced growth, with City A increasing to 550 new customers, City B rising to 750, and City C reaching 650.
Body 2
By March, the upward trend continued across all cities. City A saw an increase to 600 new customers, while City B reached 800, maintaining its position as the leader. City C also grew to 700 new customers. Throughout the period, each city consistently added more new customers each month, with City B showing the most significant increase overall.
In summary, the data indicates a positive growth trend in the number of new customers across all three cities, with City B consistently attracting the highest numbers.
Bài mẫu 3
Introduction
The table illustrates the number of new customers acquired in three different cities—City A, City B, and City C—over a period of three months.
Overview
Overall, the data shows a steady increase in the number of new customers in all three cities from January to March. City B consistently had the highest number of new customers, while City A had the lowest, though it showed the most significant growth rate over the period.
Body 1
In January, City B led with 700 new customers, followed by City C with 600, and City A with 500. In February, the number of new customers rose to 750 in City B, 650 in City C, and 550 in City A. This indicates a consistent increase across all cities, with City B maintaining its lead.
Body 2
By March, City B continued to attract the most new customers, reaching 800, an increase of 100 from February. City C also saw a rise to 700 new customers, maintaining a steady growth of 50 new customers per month. City A, while having the lowest figures, showed the highest percentage increase, growing from 500 in January to 600 in March, an increase of 100 new customers, matching the numerical growth seen in City B but from a lower base.
In conclusion, all three cities experienced growth in their new customer numbers over the three-month period, with City B consistently having the highest figures and City A showing the most significant relative growth.