IELTS Writing Task 1 yêu cầu mô tả biểu đồ thanh minh họa số lượng vé xem phim bán ra trong ba tuần của ba công ty khác nhau. Bài viết cần so sánh và phân tích xu hướng, điểm khác biệt giữa các công ty qua các tuần. Đảm bảo nêu rõ các chi tiết chính và tổng quan về dữ liệu.
Đọc bài này Cách làm bài IELTS Writing Task 1 Bar Chart trước khi làm bài.
Bạn cũng có thể đọc lại bài nói về Task 1 tại đây: IELTS Writing Task 1 cần lưu ý những gì?
Đọc thêm về xây dựng lộ trình học IELTS của The Real IELTS.
IELTS Writing Task 1 Bar Chart: Movie Tickets
You should spent about 20 mintutes on this task
IELTS Writing Task 1 requires describing a bar chart illustrating the number of movie tickets sold over three weeks by three different companies. The essay should compare and analyze trends and differences between the companies over the weeks. Make sure to highlight the main details and provide an overall summary of the data.
You should write at least 150 words
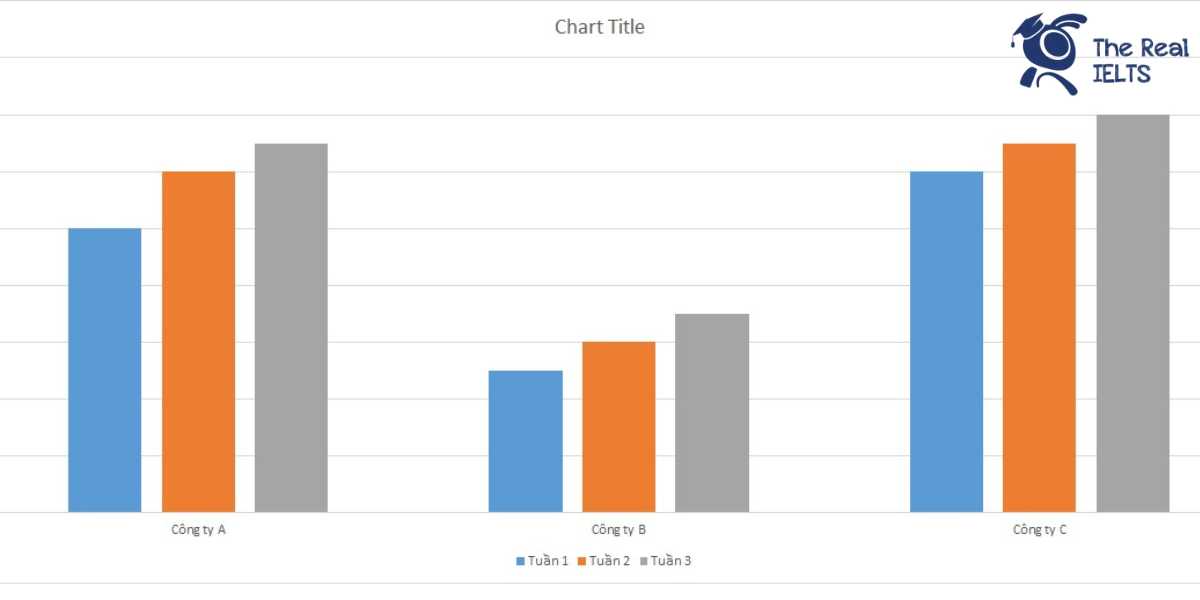
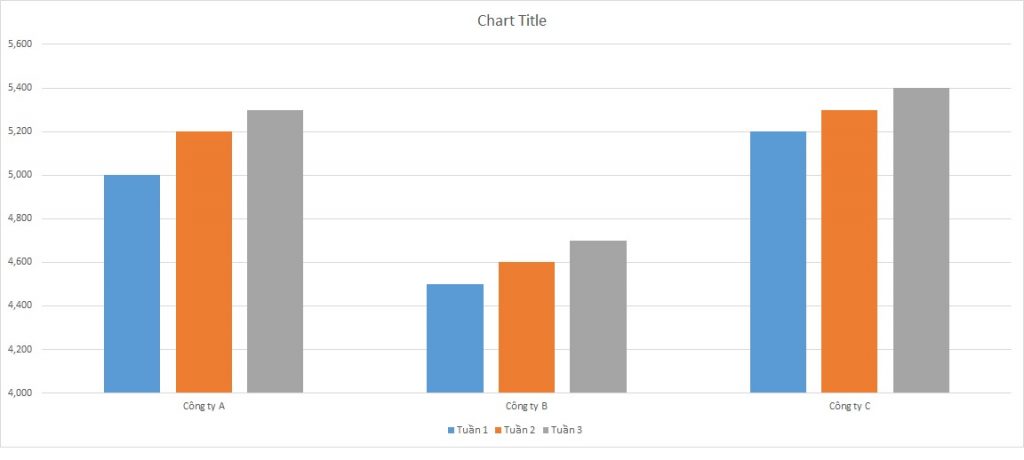
| Tuần | Công ty A | Công ty B | Công ty C |
| Tuần 1 | 5,000 | 4,500 | 5,200 |
| Tuần 2 | 5,200 | 4,600 | 5,300 |
| Tuần 3 | 5,300 | 4,700 | 5,400 |
Bài mẫu 1
The table provides data on the number of movie tickets sold by three companies (Company A, Company B, and Company C) over a period of three weeks.
Overall, all three companies experienced a steady increase in ticket sales throughout the period. Company C consistently sold the highest number of tickets each week, while Company B sold the least.
In the first week, Company C sold 5,200 tickets, which was the highest among the three companies. Company A followed with 5,000 tickets, and Company B sold 4,500 tickets. By the second week, all companies saw an increase in sales. Company C’s sales rose to 5,300, maintaining its lead. Company A’s sales increased to 5,200, and Company B’s sales went up to 4,600.
In the third week, the upward trend continued for all companies. Company C reached 5,400 tickets, Company A sold 5,300 tickets, and Company B increased its sales to 4,700 tickets. This consistent growth indicates a positive trend in movie ticket sales for all three companies over the three-week period.
In summary, Company C led in ticket sales each week, while Company B had the lowest sales. Nonetheless, each company experienced a steady increase in the number of tickets sold over the three weeks.
Bài mẫu 2
Introduction
The table illustrates the number of movie tickets sold by three companies over three weeks. The companies included are Company A, Company B, and Company C.
Overview
Overall, Company C consistently sold the most tickets each week, while Company B sold the fewest. Both Company A and Company C saw a steady increase in ticket sales over the period, whereas Company B’s sales showed a modest rise.
Body 1
In the first week, Company A sold 5,000 tickets, which was slightly less than Company C, which sold 5,200 tickets. Company B, on the other hand, sold the least, with 4,500 tickets. By the second week, Company A’s sales increased to 5,200 tickets, Company B’s sales rose slightly to 4,600, and Company C continued to lead with 5,300 tickets.
Body 2
The upward trend continued in the third week for all companies. Company A sold 5,300 tickets, marking an increase of 300 tickets over the three weeks. Company B’s sales, although still the lowest, reached 4,700 tickets. Company C remained the highest seller, with 5,400 tickets in the final week, showing a steady rise in their ticket sales each week.