IELTS Writing Task 1 yêu cầu mô tả biểu đồ Bar Chart về chi phí y tế trong 3 tháng của ba bệnh viện. Biểu đồ hiển thị so sánh chi phí y tế hàng tháng, cho thấy sự biến động chi phí giữa các bệnh viện. Thí sinh cần phân tích dữ liệu và trình bày xu hướng chính xác và khách quan.
Đọc bài này Cách làm bài IELTS Writing Task 1 Bar Chart trước khi làm bài.
Bạn cũng có thể đọc lại bài nói về Task 1 tại đây: IELTS Writing Task 1 cần lưu ý những gì?
Đọc thêm về xây dựng lộ trình học IELTS của The Real IELTS.
IELTS Writing Task 1 Bar Chart: Medical Expenses
You should spent about 20 mintutes on this task
IELTS Writing Task 1 requires describing a Bar Chart depicting the medical expenses over three months for three hospitals. The chart displays a comparison of monthly medical costs, showing the fluctuations in expenses between the hospitals. Candidates need to analyze the data and present the trends accurately and objectively.
You should write at least 150 words
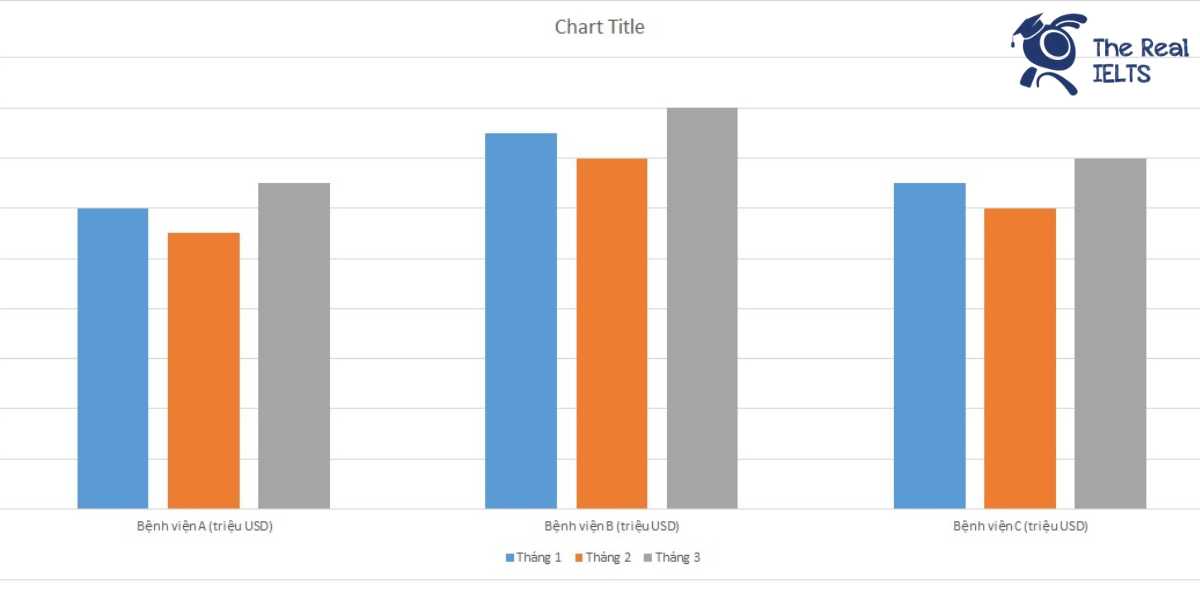
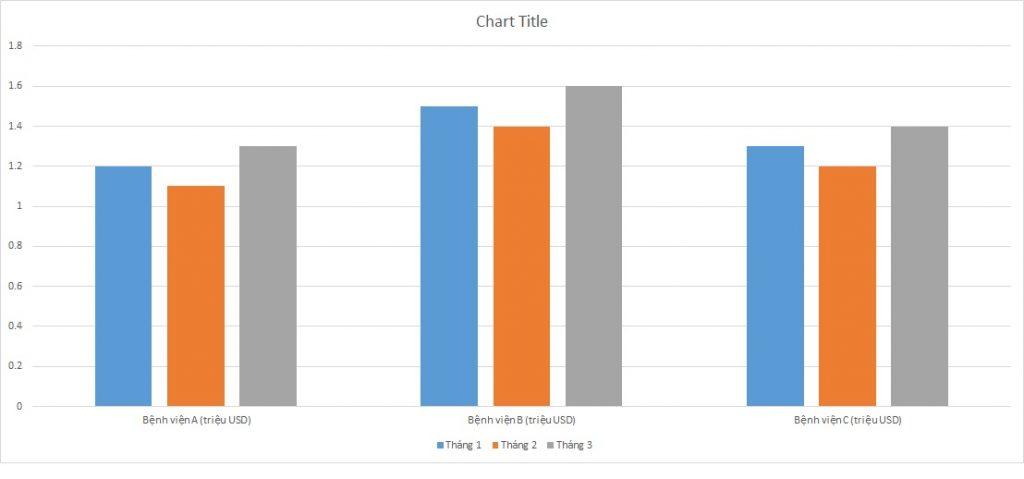
| Tháng | Bệnh viện A (triệu USD) | Bệnh viện B (triệu USD) | Bệnh viện C (triệu USD) |
| Tháng 1 | 1.2 | 1.5 | 1.3 |
| Tháng 2 | 1.1 | 1.4 | 1.2 |
| Tháng 3 | 1.3 | 1.6 | 1.4 |
Bài mẫu 1
Introduction: The table presents hypothetical data on the healthcare expenditure of three hospitals (Hospital A, Hospital B, and Hospital C) over a three-month period.
Overview: Overall, Hospital B consistently spent the most each month, while Hospital A had the lowest expenditure in two out of the three months. Despite fluctuations, the expenses for all hospitals showed an upward trend from February to March.
Body 1: In January, Hospital A’s expenditure was $1.2 million, which increased slightly to $1.3 million by March, despite a dip to $1.1 million in February. Hospital B, on the other hand, started with the highest expenditure of $1.5 million in January, decreased to $1.4 million in February, and then rose again to $1.6 million in March.
Body 2: Hospital C’s expenses followed a similar pattern to Hospital B. It started with $1.3 million in January, dropped to $1.2 million in February, and then increased to $1.4 million in March. This data indicates that while Hospital B had the highest spending overall, all three hospitals experienced a decrease in February before increasing again in March.
Bài mẫu 2
Introduction
The table provided illustrates the healthcare expenditures of three hospitals (A, B, and C) over the first three months of the year, with costs presented in millions of USD.
Overview
Overall, Hospital B consistently had the highest monthly expenses among the three hospitals, while Hospital A had the lowest expenditures in February. All three hospitals showed fluctuations in their monthly costs throughout the period.
Body 1
In January, Hospital A spent $1.2 million, Hospital B spent $1.5 million, and Hospital C spent $1.3 million. By February, the expenditures for Hospital A and C both decreased to $1.1 million and $1.2 million, respectively. Hospital B also saw a reduction in costs, spending $1.4 million.
Body 2
In March, the expenditures for all three hospitals increased. Hospital A’s costs rose to $1.3 million, while Hospital B’s costs reached $1.6 million, the highest expenditure recorded during the three-month period. Hospital C also experienced an increase, with expenses rising to $1.4 million.
Summary
In summary, although all three hospitals showed variable spending patterns over the three-month period, Hospital B consistently had the highest expenditures, whereas Hospital A generally had the lowest costs.