IELTS Writing Task 1 yêu cầu mô tả biểu đồ Bar Chart thể hiện số lượng xe máy bán ra trong ba tháng từ ba hãng khác nhau. Bài viết cần trình bày rõ ràng và chính xác các số liệu, so sánh sự khác biệt giữa các hãng, và phân tích xu hướng bán hàng trong từng tháng. Người viết nên sử dụng từ vựng phong phú và cấu trúc ngữ pháp đa dạng để đạt điểm cao.
Đọc bài này Cách làm bài IELTS Writing Task 1 Bar Chart trước khi làm bài.
Bạn cũng có thể đọc lại bài nói về Task 1 tại đây: IELTS Writing Task 1 cần lưu ý những gì?
Đọc thêm về xây dựng lộ trình học IELTS của The Real IELTS.
IELTS Writing Task 1 Bar Chart: Motorcycles Sold
You should spent about 20 mintutes on this task
IELTS Writing Task 1 requires describing a Bar Chart showing the number of motorcycles sold over three months by three different companies. The essay should present the data clearly and accurately, compare the differences between the companies, and analyze the sales trends for each month. The writer should use rich vocabulary and varied grammatical structures to achieve a high score.
You should write at least 150 words
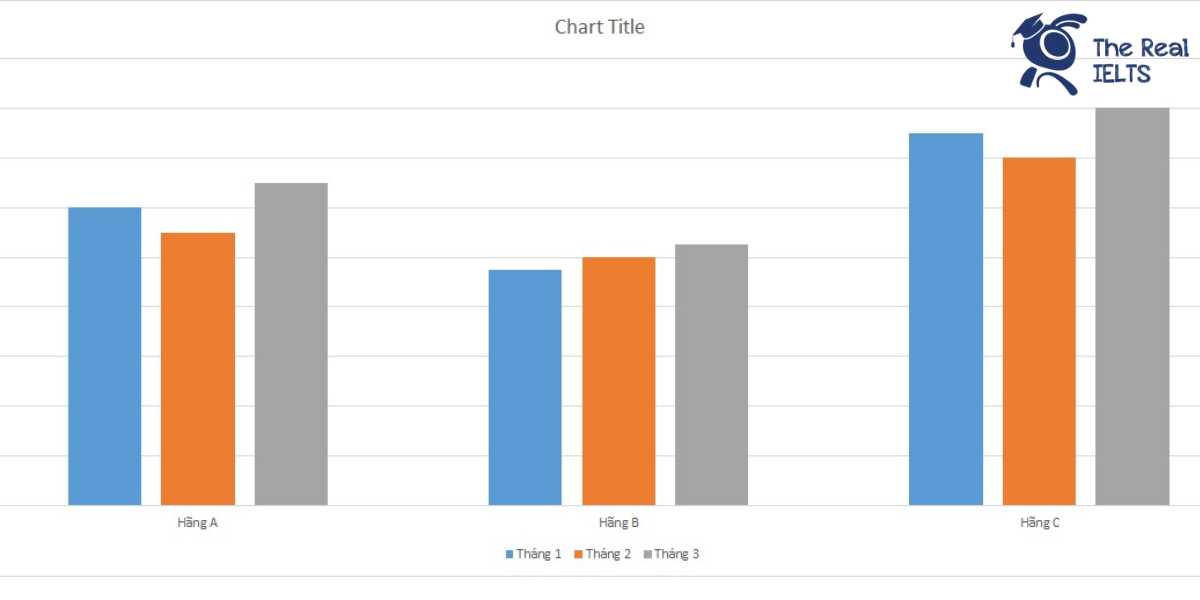
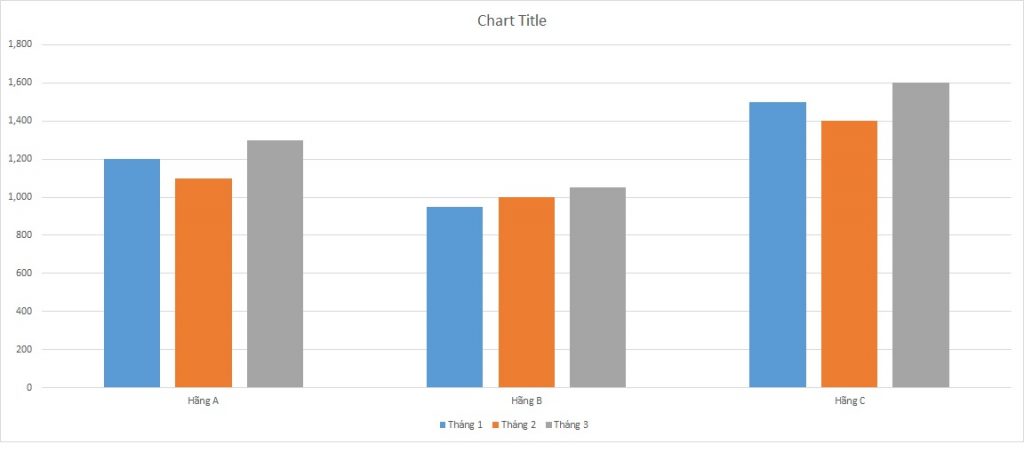
| Hãng xe | Tháng 1 | Tháng 2 | Tháng 3 |
| Hãng A | 1,200 | 1,100 | 1,300 |
| Hãng B | 950 | 1,000 | 1,050 |
| Hãng C | 1,500 | 1,400 | 1,600 |
Bài mẫu 1
Overview
The table presents the sales data of
three different motorcycle brands (A, B, and C) over the first three months of the year. It provides insights into the sales trends and performance of each brand, offering a clear comparison of their market presence during this period.
Body 1
In January, Brand A sold 1,200 motorcycles, while Brand B sold 950, and Brand C led the market with 1,500 units sold. This month saw Brand C as the top
performer, indicating a strong market preference for its motorcycles. Brand A also showed a significant presence, while Brand B lagged slightly behind the other two.
Body 2
February’s sales figures reveal some shifts in the market dynamics. Brand A’s sales slightly decreased to 1,100 units, whereas Brand B experienced a modest increase, selling 1,000 motorcycles. Brand C, though still leading, saw a decrease to 1,400 units. This month shows a narrowing gap between the brands, with Brand B closing in on Brand A’s sales figures.
Body 3
In March, all three brands experienced an increase in sales. Brand A sold 1,300 motorcycles, marking the highest sales figure for this brand in the three-month period. Brand B continued its upward trend with 1,050 units sold. Brand C maintained its lead, further increasing its sales to 1,600 motorcycles. This final month highlights Brand C’s dominance in the market, with consistent sales growth, while Brands A and B also demonstrated positive trajectories.
Overall, the sales data indicates that Brand C consistently outperformed the other two brands, although all brands showed growth by the end of the three-month period.
Bài mẫu 2
Overview
The table provides a hypothetical statistical overview of motorcycle sales across three months (January, February, and March) for three different manufacturers: Company A, Company B, and Company C. This data helps in understanding the trends in sales performance of these companies over the first quarter of the year.
Body 1
In January, Company C leads the sales with 1,500 motorcycles sold, followed by Company A with 1,200 motorcycles, and Company B with 950 motorcycles. This initial month sets the stage with Company C having a significant lead over the other two companies. Company A shows moderate performance, while Company B lags behind, indicating a potential need for marketing strategies or product improvements to catch up with competitors.
Body 2
As the months progress, there are notable changes in the sales figures. In February, all companies experience a slight decline in sales except for Company B, which sees an increase to 1,000 motorcycles. Company A’s sales drop to 1,100 motorcycles, and Company C sees a decrease to 1,400 motorcycles. In March, sales rebound for all companies. Company C maintains its lead with 1,600 motorcycles, followed by Company A with 1,300 motorcycles, and Company B with 1,050 motorcycles. The data indicates a robust recovery and an upward trend in sales as the quarter concludes. Company C remains the top seller throughout the quarter, while Company A and Company B show fluctuating but generally positive trends.