IELTS Writing Task 1 yêu cầu mô tả biểu đồ cột về tỷ lệ sinh viên bỏ học trong ba năm tại ba trường đại học khác nhau. Biểu đồ thể hiện tỷ lệ sinh viên bỏ học qua từng năm, từ đó giúp đánh giá xu hướng và so sánh mức độ bỏ học giữa các trường. Người viết cần phân tích dữ liệu một cách rõ ràng, nêu bật những điểm chính và đưa ra nhận xét phù hợp.
Đọc bài này Cách làm bài IELTS Writing Task 1 Bar Chart trước khi làm bài.
Bạn cũng có thể đọc lại bài nói về Task 1 tại đây: IELTS Writing Task 1 cần lưu ý những gì?
Đọc thêm về xây dựng lộ trình học IELTS của The Real IELTS.
IELTS Writing Task 1 Bar Chart: Dropout Rates
You should spent about 20 mintutes on this task
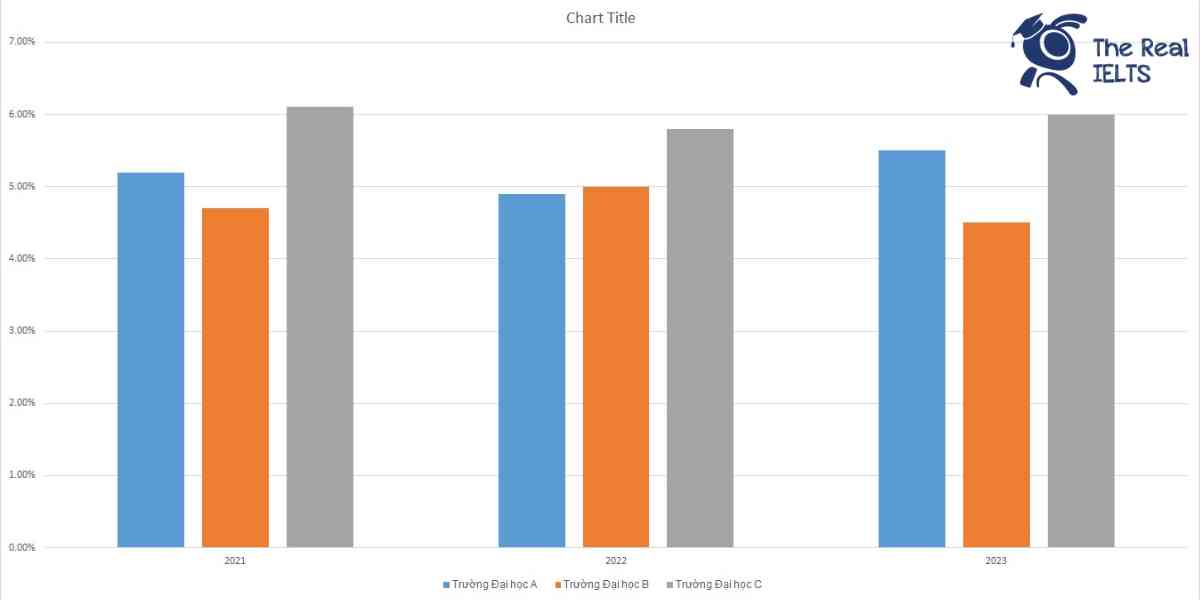
IELTS Writing Task 1 requires describing a bar chart showing the dropout rates of students over three years at three different universities. The chart illustrates the dropout rates year by year, allowing for the assessment of trends and comparison of dropout levels between the universities. The writer needs to analyze the data clearly, highlight key points, and provide appropriate comments.
You should write at least 150 words.
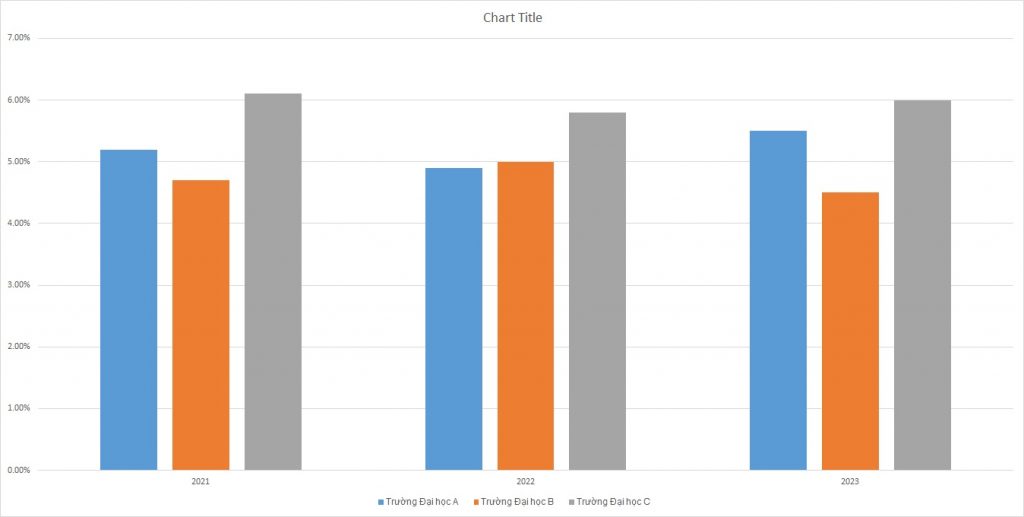
| Năm | Trường Đại học A | Trường Đại học B | Trường Đại học C |
| 2021 | 5.20% | 4.70% | 6.10% |
| 2022 | 4.90% | 5.00% | 5.80% |
| 2023 | 5.50% | 4.50% | 6.00% |
Bài mẫu 1
Overview
This report presents a comparative analysis of student dropout rates over three years (2021, 2022, and 2023) at three different universities: University A, University B, and University C. The data, which are hypothetical, reveal trends and fluctuations in dropout rates across these institutions, providing insight into potential factors influencing student retention.
Body 1
University A
In 2021, University A experienced a dropout rate of 5.2%. This rate decreased slightly in 2022 to 4.9%, indicating a minor improvement in student retention efforts. However, in 2023, the dropout rate increased to 5.5%, surpassing the rate from 2021. This fluctuation suggests that while there may have been temporary improvements, sustaining long-term retention remains a challenge for University A.
University B
University B started with a dropout rate of 4.7% in 2021. This rate increased marginally to 5.0% in 2022. By 2023, the rate decreased to 4.5%, the lowest among the three universities for that year. The overall trend at University B shows a more stable and slightly improving retention rate, indicating effective strategies in place to reduce dropouts.
Body 2
University C
University C had the highest dropout rate among the three universities in 2021, at 6.1%. This rate showed a slight improvement in 2022, decreasing to 5.8%. However, in 2023, the rate was 6.0%, a marginal increase from the previous year. Despite efforts to improve, University C consistently faced higher dropout rates, suggesting a need for targeted interventions to better support student retention.
Comparative Analysis
Comparing the three universities, University B appears to have the most stable and effective retention strategies, with a noticeable decrease in dropout rates by 2023. University A shows some inconsistency, with an overall increase in dropout rates over the three years. University C, while showing some improvement, still struggles with the highest dropout rates, indicating significant room for enhancement in their retention efforts.
Bài mẫu 2
Overview
This report provides an analysis of the dropout rates at three different universities over a period of three years (2021, 2022, and 2023). The universities in focus are University A, University B, and University C. The statistics show the percentage of students who discontinued their studies each year.
Body 1
In 2021, University A had a dropout rate of 5.2%, which was slightly higher than University B’s rate of 4.7% but lower than University C’s rate of 6.1%. This indicates that University A was in the middle range regarding student retention compared to the other two universities. University C had the highest dropout rate, suggesting potential issues in student satisfaction or support systems.
In 2022, the dropout rates for University A and University C decreased to 4.9% and 5.8%, respectively. However, University B experienced a slight increase to 5.0%. The reduction in dropout rates for Universities A and C might indicate improvements in their academic support or student engagement strategies, while the increase for University B could suggest emerging challenges in retaining students.
Body 2
In 2023, University A’s dropout rate rose to 5.5%, marking an increase from the previous year. Conversely, University B’s dropout rate decreased significantly to 4.5%, the lowest among the three universities for that year. University C’s rate slightly decreased to 6.0%, maintaining the trend of having the highest dropout rate. The fluctuations in dropout rates across these universities could be attributed to various factors such as changes in academic policies, student support services, and external socioeconomic conditions.
In summary, the dropout rates over these three years show varying trends among the three universities. University B’s significant improvement in 2023 is noteworthy, while University A’s increased rate may warrant further investigation into possible causes. University C consistently has the highest dropout rates, indicating a persistent need for addressing underlying issues to enhance student retention.