IELTS Writing Task 1 yêu cầu mô tả biểu đồ Bar Chart về chi phí quảng cáo từ năm 2011 đến năm 2013 qua ba kênh khác nhau. Nhiệm vụ của thí sinh là phân tích xu hướng chi phí trong khoảng thời gian này, so sánh các kênh quảng cáo và nhận xét về sự biến đổi của từng kênh qua các năm.
Đọc bài này Cách làm bài IELTS Writing Task 1 Bar Chart trước khi làm bài.
Bạn cũng có thể đọc lại bài nói về Task 1 tại đây: IELTS Writing Task 1 cần lưu ý những gì?
IELTS Writing Task 1 Bar Chart: Advertising Costs
You should spent about 20 mintutes on this task
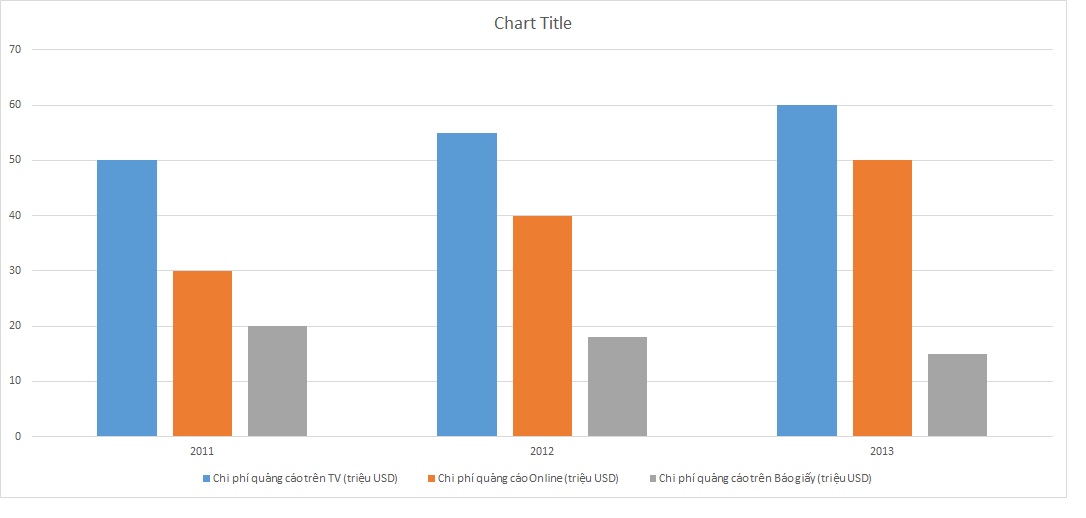
IELTS Writing Task 1 requires describing a Bar Chart about advertising costs from 2011 to 2013 across three different channels. The task for candidates is to analyze the cost trends over this period, compare the advertising channels, and comment on the changes in each channel over the years.
You should write at least 150 words.
| Năm | Chi phí quảng cáo trên TV (triệu USD) | Chi phí quảng cáo Online (triệu USD) | Chi phí quảng cáo trên Báo giấy (triệu USD) |
| 2011 | 50 | 30 | 20 |
| 2012 | 55 | 40 | 18 |
| 2013 | 60 | 50 | 15 |

Bài mẫu 1
Introduction
The table provides a breakdown of advertising expenditure across three different media channels—TV, Online, and Newspapers—over the period from 2011 to 2013. The figures are presented in millions of USD.
Overview
Overall, advertising expenses increased for both TV and online platforms throughout the three years, while expenditures on newspaper advertising showed a consistent decline. This trend highlights a shift in preference towards digital and broadcast media over traditional print media.
Body 1
In 2011, TV advertising led the market with a spend of 50 million USD, followed by online advertising at 30 million USD, and newspaper advertising at 20 million USD. The following year, TV advertising saw a rise to 55 million USD, maintaining its leading position. Online advertising also experienced significant growth, reaching 40 million USD. In contrast, newspaper advertising decreased slightly to 18 million USD.
Body 2
By 2013, the expenditure on TV advertising had further increased to 60 million USD, continuing to dominate the advertising market. Online advertising saw the most substantial growth over the period, reaching 50 million USD. Meanwhile, newspaper advertising continued its downward trend, falling to 15 million USD. This consistent decline reflects the growing preference for digital and broadcast advertising over traditional print media.
In conclusion, the data indicates a clear trend of increasing investment in TV and online advertising, with a corresponding decrease in newspaper advertising over the three-year period.
Bài mẫu 2
Introduction
The provided table illustrates the advertising expenditure across three different media channels (TV, Online, and Newspapers) over a three-year period from 2011 to 2013.
Overview
Overall, there was a noticeable increase in advertising spending on TV and Online platforms, while expenditure on Newspapers experienced a gradual decline throughout the given period.
Body 1
In 2011, advertising expenditure on TV stood at $50 million, which was the highest among the three channels. This figure continued to rise, reaching $55 million in 2012 and $60 million in 2013. Meanwhile, online advertising expenses also saw a significant increase, starting at $30 million in 2011, climbing to $40 million in 2012, and further increasing to $50 million by 2013.
Body 2
Contrastingly, the expenditure on newspaper advertising showed a declining trend. In 2011, the advertising cost for newspapers was $20 million. This amount decreased slightly to $18 million in 2012 and further dropped to $15 million in 2013. This decline indicates a shift in advertising preferences from traditional print media to more modern digital and television platforms.
Conclusion
In summary, from 2011 to 2013, there was a clear upward trend in advertising expenditure on TV and Online channels, while spending on Newspaper advertising consistently decreased, highlighting a shift in advertising strategies towards more dynamic and digital media.
Bài mẫu 3
The table below shows the advertising expenditures from 2011 to 2013 across three different channels: TV, Online, and Newspapers.
Overview: Overall, there was an upward trend in advertising spending on TV and online platforms, while expenditure on newspaper advertisements saw a consistent decline over the period.
Body 1: In 2011, TV advertising held the highest expenditure at $50 million, followed by online advertising at $30 million, and newspaper advertising at $20 million. By 2012, TV advertising increased to $55 million, marking a $5 million rise. Online advertising saw a more significant jump, growing by $10 million to reach $40 million. Conversely, newspaper advertising declined slightly to $18 million.
Body 2: The trend continued in 2013, with TV advertising expenses reaching $60 million, maintaining its position as the most costly advertising medium. Online advertising saw the most substantial growth, increasing by another $10 million to $50 million. Newspaper advertising, however, continued its downward trend, decreasing to $15 million, the lowest among the three categories.
In conclusion, the data indicates a shift in advertising preferences towards digital platforms, with online advertising showing the most significant growth, while traditional newspaper advertising steadily declined.
Bài mẫu 4
Introduction
The table illustrates the annual advertising expenditures for three different channels (TV, Online, and Newspapers) from 2011 to 2013, measured in millions of USD.
Overview
Overall, there was an upward trend in advertising spending across all channels, except for Newspapers, which saw a decline over the given period. TV consistently had the highest expenditure, while Online advertising showed the most significant growth.
Body Paragraph 1
In 2011, TV advertising costs stood at 50 million USD, making it the highest among the three channels. This figure increased steadily to 55 million USD in 2012 and further to 60 million USD in 2013. Online advertising also saw a significant rise, starting at 30 million USD in 2011, growing to 40 million USD in 2012, and reaching 50 million USD in 2013, matching the expenditure of TV advertising in its final year.
Body Paragraph 2
Conversely, the expenditure on Newspaper advertising decreased over the three years. Starting at 20 million USD in 2011, it dropped to 18 million USD in 2012 and further to 15 million USD in 2013. This decline contrasts with the increasing investments in TV and Online advertising, indicating a shift in preference towards more modern advertising mediums over traditional print media.
Bài mẫu 5
Introduction
The table presents the expenditure on advertising through three different channels (TV, Online, and Newspapers) from 2011 to 2013, with the figures provided in millions of USD.
Overview
Overall, advertising expenses increased for both TV and Online channels over the three-year period, while spending on Newspaper advertising decreased. TV remained the highest spending category each year, followed by Online advertising, with Newspapers consistently having the lowest expenditures.
Body 1
In 2011, the advertising budget for TV was the highest at 50 million USD, followed by Online advertising at 30 million USD, and Newspaper advertising at 20 million USD. In 2012, all categories saw changes: TV advertising rose to 55 million USD, Online advertising increased significantly to 40 million USD, while Newspaper advertising decreased slightly to 18 million USD.
Body 2
By 2013, the trend continued with TV advertising expenses reaching 60 million USD, maintaining its leading position. Online advertising saw a substantial growth, reaching 50 million USD, nearly doubling from its 2011 figures. In contrast, Newspaper advertising continued its decline, dropping to 15 million USD. This data highlights a shift in advertising preferences towards digital media over the three years.