IELTS Writing Task 1 yêu cầu bạn mô tả lượng tiêu thụ rượu bia trong ba ngày tại ba quán bia, dựa trên biểu đồ cột. Bar Chart này thể hiện sự thay đổi về mức độ tiêu thụ ở mỗi quán qua các ngày khác nhau. Bạn cần phân tích số liệu và so sánh sự khác biệt giữa các quán.
Đọc bài này Cách làm bài IELTS Writing Task 1 Bar Chart trước khi làm bài.
Bạn cũng có thể đọc lại bài nói về Task 1 tại đây: IELTS Writing Task 1 cần lưu ý những gì?
Đọc thêm về xây dựng lộ trình học IELTS của The Real IELTS.
IELTS Writing Task 1 Bar Chart: Alcohol Consumption
You should spent about 20 mintutes on this task
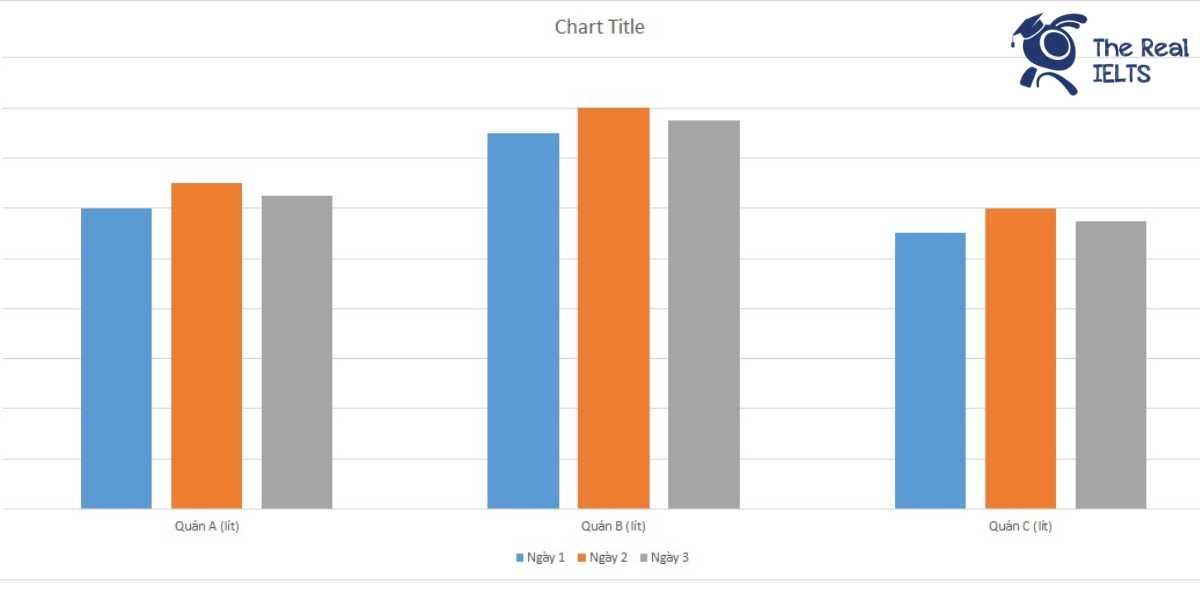
IELTS Writing Task 1 requires you to describe the alcohol consumption over three days at three pubs, based on a bar chart. This bar chart shows the changes in consumption levels at each pub across different days. You need to analyze the data and compare the differences between the pubs.
You should write at least 150 words
| Ngày | Quán A (lít) | Quán B (lít) | Quán C (lít) |
| Ngày 1 | 120 | 150 | 110 |
| Ngày 2 | 130 | 160 | 120 |
| Ngày 3 | 125 | 155 | 115 |

Bài mẫu 1
Introduction:
The table illustrates the consumption of alcoholic beverages in liters over three days at three different pubs: Pub A, Pub B, and Pub C.
Overview:
Overall, Pub B consistently had the highest consumption across all three days, while Pub C had the lowest. The consumption patterns for each pub remained relatively stable with minor fluctuations.
Body 1:
On the first day, Pub B recorded the highest consumption at 150 liters, followed by Pub A with 120 liters and Pub C with 110 liters. On the second day, there was a noticeable increase in consumption for all pubs. Pub B’s consumption rose to 160 liters, Pub A’s to 130 liters, and Pub C’s to 120 liters.
Body 2:
On the third day, there was a slight decrease in the amount of alcohol consumed at Pub A and Pub C, with Pub A recording 125 liters and Pub C 115 liters. However, Pub B experienced a slight drop to 155 liters but still maintained the highest consumption among the three pubs.
Conclusion:
In conclusion, Pub B consistently had the highest alcohol consumption over the three days, while Pub C had the lowest. The overall trend showed minor fluctuations in consumption across all three pubs.
Bài mẫu 2
Introduction
The table provides data on the consumption of alcoholic beverages in liters over three days at three different pubs: Pub A, Pub B, and Pub C.
Overview
Overall, Pub B consistently had the highest consumption of alcohol each day, while Pub C had the lowest. The amount of alcohol consumed in each pub showed slight variations over the three days.
Body 1
On the first day, Pub A recorded a consumption of 120 liters, Pub B had the highest at 150 liters, and Pub C consumed 110 liters. On the second day, the consumption increased across all pubs, with Pub A consuming 130 liters, Pub B reaching 160 liters, and Pub C consuming 120 liters. This indicates a general trend of increased alcohol consumption from the first to the second day.
Body 2
On the third day, the consumption in all pubs slightly decreased compared to the second day but remained higher than on the first day. Pub A recorded 125 liters, Pub B had 155 liters, and Pub C consumed 115 liters. This suggests a slight decline in consumption after a peak on the second day, yet the figures remained relatively high.
Conclusion
In conclusion, Pub B consistently had the highest alcohol consumption over the three days, while Pub C had the lowest. The consumption patterns indicate a peak on the second day for all pubs, followed by a slight decrease on the third day.