IELTS Writing Task 1 yêu cầu bạn mô tả một biểu đồ Bar Chart về số lượng đơn xin nhập học trong 3 năm của ba trường đại học. Biểu đồ hiển thị số liệu cụ thể của từng trường theo từng năm, giúp so sánh sự thay đổi và xu hướng trong lượng đơn xin nhập học. Bạn cần phân tích và so sánh dữ liệu, nhấn mạnh các điểm nổi bật và sự khác biệt giữa các trường qua từng năm.
Đọc bài này Cách làm bài IELTS Writing Task 1 Bar Chart trước khi làm bài.
Bạn cũng có thể đọc lại bài nói về Task 1 tại đây: IELTS Writing Task 1 cần lưu ý những gì?
Đọc thêm về xây dựng lộ trình học IELTS của The Real IELTS.
IELTS Writing Task 1 Bar Chart: Applications
You should spent about 20 mintutes on this task
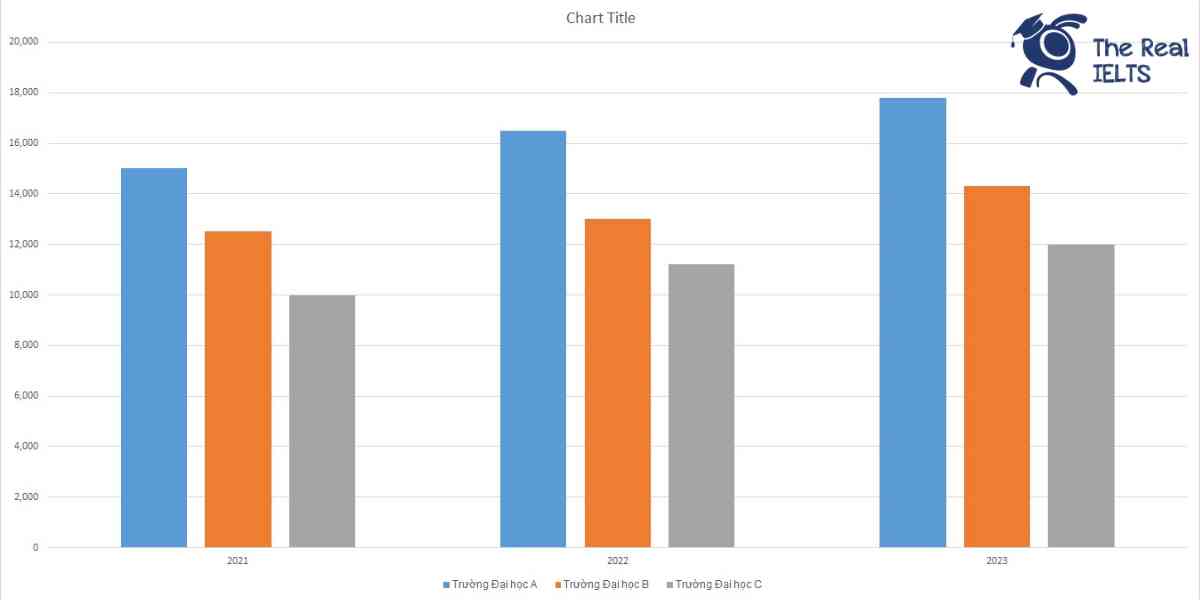
IELTS Writing Task 1 requires you to describe a Bar Chart showing the number of admission applications over three years for three universities. The chart displays specific data for each university by year, helping to compare changes and trends in the number of applications. You need to analyze and compare the data, highlighting key points and differences between the universities over the years.
You should write at least 150 words.
| Năm | Trường Đại học A | Trường Đại học B | Trường Đại học C |
| 2021 | 15,000 | 12,500 | 10,000 |
| 2022 | 16,500 | 13,000 | 11,200 |
| 2023 | 17,800 | 14,300 | 12,000 |

Bài mẫu 1
Overview
The table presents data on the number of admission applications received by three hypothetical universities over a three-year period from 2021 to 2023. The universities in question are University A, University B, and University C. The figures show a consistent upward trend in the number of applications for all three institutions.
Body 1
In 2021, University A received 15,000 applications, University B received 12,500, and University C received 10,000. This sets the initial baseline for comparison. By 2022, all three universities experienced an increase in applications: University A’s numbers rose to 16,500, showing a significant increase of 1,500 applications. Similarly, University B saw an increase of 500 applications, bringing their total to 13,000. University C also saw growth, with applications rising to 11,200, marking an increase of 1,200 applications compared to the previous year.
Body 2
The trend of increasing applications continued into 2023. University A received 17,800 applications, which is 1,300 more than in 2022. University B experienced an even larger increase, with applications rising by 1,300 to reach 14,300. University C also saw continued growth, with applications increasing by 800 to a total of 12,000. Over the three-year period, University A showed the most substantial increase in applications, followed closely by University B and University C. This consistent rise indicates a growing interest in these universities, potentially due to factors such as reputation, academic offerings, and successful marketing strategies.
Bài mẫu 2
Overview
The statistics over a three-year period show the number of admission applications to three hypothetical universities: University A, University B, and University C. The data highlights an upward trend in the number of applications for all three institutions, reflecting their growing popularity or possibly increased student population during these years.
Body 1
University A experienced a significant increase in applications from 2021 to 2023. In 2021, the university received 15,000 applications. This number rose to 16,500 in 2022, marking an increase of 1,500 applications. By 2023, applications further increased to 17,800, showing a year-on-year growth. This consistent rise suggests that University A may have enhanced its programs or reputation, attracting more prospective students each year.
Body 2
Similarly, University B and University C saw a steady growth in application numbers. University B had 12,500 applications in 2021, which increased to 13,000 in 2022, and reached 14,300 in 2023. This gradual increase indicates a positive trend, albeit at a slower rate compared to University A. University C started with 10,000 applications in 2021, grew to 11,200 in 2022, and reached 12,000 by 2023. The growth for University C, though not as pronounced as the other two universities, still signifies a healthy rise in interest among applicants. Overall, the data indicates a positive trajectory in application numbers for all three universities over the observed period.