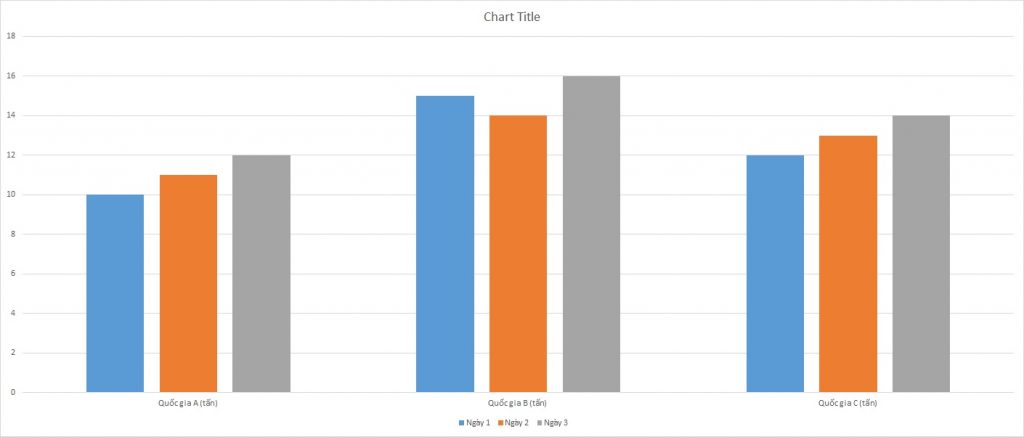
IELTS Writing Task 1 yêu cầu bạn mô tả biểu đồ cột thể hiện lượng tiêu thụ bánh kẹo trong 3 ngày của 3 quốc gia khác nhau. Bạn cần nêu rõ số lượng bánh kẹo tiêu thụ ở từng quốc gia theo từng ngày, so sánh các quốc gia và nhận xét về xu hướng tiêu thụ trong khoảng thời gian đó.
Đọc bài này Cách làm bài IELTS Writing Task 1 Bar Chart trước khi làm bài.
Bạn cũng có thể đọc lại bài nói về Task 1 tại đây: IELTS Writing Task 1 cần lưu ý những gì?
Đọc thêm về xây dựng lộ trình học IELTS của The Real IELTS.
IELTS Writing Task 1 Bar Chart: Candy Consumption
You should spent about 20 mintutes on this task
IELTS Writing Task 1 requires you to describe a bar chart illustrating the candy consumption over three days in three different countries. You need to specify the amount of candy consumed in each country on each day, compare the countries, and comment on the consumption trends over the given period.
You should write at least 150 words.
| Ngày | Quốc gia A (tấn) | Quốc gia B (tấn) | Quốc gia C (tấn) |
| Ngày 1 | 10 | 15 | 12 |
| Ngày 2 | 11 | 14 | 13 |
| Ngày 3 | 12 | 16 | 14 |

Bài mẫu 1
Overview
The following report presents a comparative analysis of candy consumption in three different countries over a span of three days. The countries, referred to as Country A, Country B, and Country C, have shown varying patterns of candy consumption, with Country B generally leading in terms of total consumption. The data is detailed in terms of tonnage consumed per day by each country.
Body 1: Consumption Patterns
On the first day, Country A consumed 10 tons of candy, Country B consumed 15 tons, and Country C consumed 12 tons. This initial data set indicates that Country B had the highest consumption, while Country A had the lowest.
On the second day, the consumption patterns slightly changed. Country A’s candy consumption increased to 11 tons, Country B’s decreased to 14 tons, and Country C’s increased to 13 tons. Despite the decrease, Country B still consumed more candy than the other two countries. The increase in consumption in Countries A and C shows a growing trend in candy consumption.
Body 2: Analysis of Trends
By the third day, all three countries showed an increase in candy consumption. Country A consumed 12 tons, Country B 16 tons, and Country C 14 tons. Country B continued to lead with the highest consumption, maintaining a significant margin over the other two countries.
Overall, the data demonstrates a steady increase in candy consumption over the three-day period for all countries. Country B consistently had the highest consumption, which might be due to higher population, greater preference for candies, or better availability. Countries A and C showed a parallel increase, indicating a uniform growth trend. This information could be useful for businesses and policymakers focusing on the confectionery market in these regions.
Bài mẫu 2
Overview
The table provides information on the consumption of confectionery in three different countries (A, B, and C) over a three-day period. The figures are presented in tons.
Body 1
On Day 1, Country B had the highest confectionery consumption at 15 tons, followed by Country C with 12 tons and Country A with 10 tons. On Day 2, the consumption patterns changed slightly, with Country B still leading at 14 tons, but Country C’s consumption rose to 13 tons, surpassing Country A, which consumed 11 tons.
Body 2
By Day 3, Country B continued to have the highest consumption at 16 tons, marking an increase over the previous days. Country C also saw a steady rise in consumption, reaching 14 tons. Country A showed a gradual increase in consumption over the three days, ending at 12 tons on Day 3. Overall, Country B consistently had the highest confectionery consumption, while Country A had the lowest but showed a steady upward trend.
Summary
The table indicates a consistent increase in confectionery consumption across all three countries over the three days, with Country B consistently consuming the most and Country A the least. This data suggests a growing trend in confectionery consumption in these countries during the observed period.


