IELTS Writing Task 1 yêu cầu thí sinh phân tích biểu đồ Bar Chart về chi phí bảo dưỡng ô tô trong 3 tháng của ba gia đình. Thí sinh cần mô tả xu hướng và so sánh mức chi tiêu giữa các gia đình trong từng tháng, nhấn mạnh những điểm tương đồng và khác biệt. Việc sử dụng từ vựng chính xác và cấu trúc câu linh hoạt sẽ giúp bài viết đạt điểm cao.
Đọc bài này Cách làm bài IELTS Writing Task 1 Bar Chart trước khi làm bài.
Bạn cũng có thể đọc lại bài nói về Task 1 tại đây: IELTS Writing Task 1 cần lưu ý những gì?
Đọc thêm về xây dựng lộ trình học IELTS của The Real IELTS.
IELTS Writing Task 1 Bar Chart: Car Maintenance
You should spent about 20 mintutes on this task
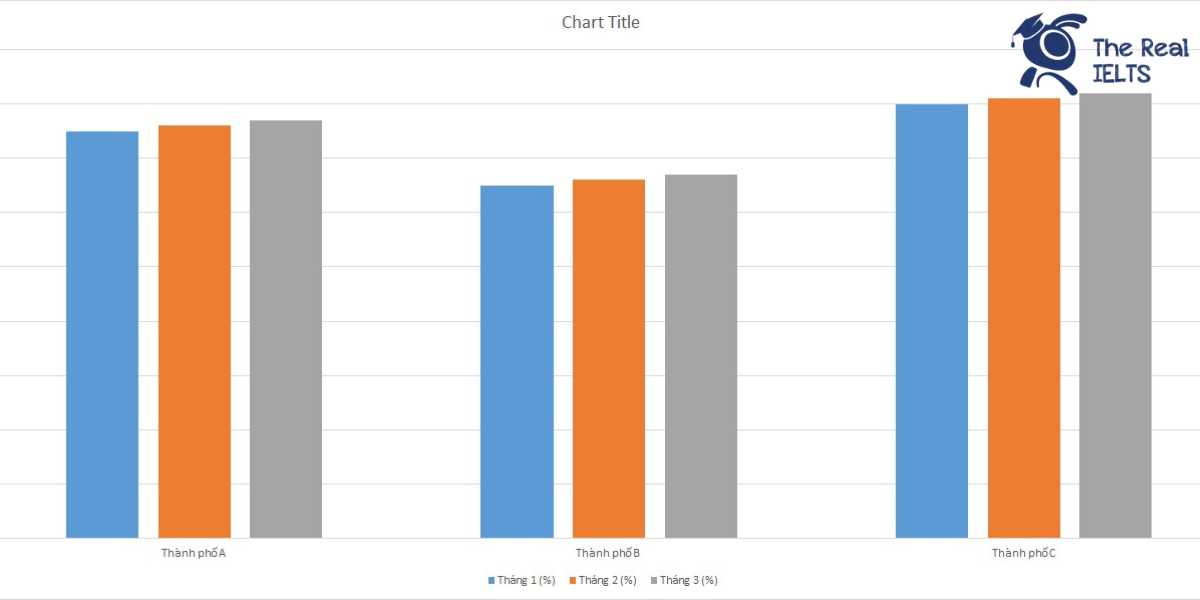
IELTS Writing Task 1 requires candidates to analyze a Bar Chart showing the car maintenance costs over 3 months for three families. Candidates need to describe trends and compare spending levels among the families each month, highlighting similarities and differences. Using precise vocabulary and flexible sentence structures will help achieve a high score.
You should write at least 150 words.
| Gia đình | Tháng 1 (USD) | Tháng 2 (USD) | Tháng 3 (USD) |
| Gia đình A | 150 | 200 | 180 |
| Gia đình B | 120 | 160 | 140 |
| Gia đình C | 180 | 220 | 200 |

Bài mẫu 1
Overview
This report provides an analysis of car maintenance costs over three months for three families: A, B, and C. The data presents monthly expenses in USD, revealing trends and comparing the financial burdens faced by each family.
Body 1
Family A
Family A’s maintenance costs show some fluctuation over the three months. In January, they spent $150, which increased to $200 in February, and slightly decreased to $180 in March. This suggests that while there were increased maintenance needs or perhaps higher service costs in February, they managed to reduce expenses slightly by March. The total expenditure for Family A over these three months is $530.
Family B
Family B’s expenses also varied, but they generally spent less compared to Family A. In January, their costs were $120, which rose to $160 in February, and then decreased to $140 in March. This pattern is similar to Family A, though their overall costs remained lower. Family B’s total maintenance costs over the three months amount to $420, making them the most economical of the three families.
Body 2
Family C
Family C consistently had the highest maintenance expenses among the three families. They spent $180 in January, which increased to $220 in February, and decreased slightly to $200 in March. This family saw the most significant variation in monthly costs, and their total expenses for the three months reached $600. This indicates either higher service needs or possibly more extensive maintenance being performed on their vehicle.
Comparison and Conclusion
Comparing the three families, Family C had the highest maintenance costs, followed by Family A, and Family B had the lowest. Family A and C had similar patterns of increased expenses in February followed by a decrease in March. Family B’s expenses were the most stable, with smaller fluctuations. This analysis highlights how different families might experience varying car maintenance costs based on usage, car condition, and maintenance practices.
Bài mẫu 2
Overview
The following analysis examines the car maintenance expenses for three families over a span of three months. By evaluating the provided data, we aim to understand the spending patterns and identify any significant trends in the maintenance costs for Family A, Family B, and Family C.
Body 1
In the first month, the maintenance costs for Family A, Family B, and Family C were $150, $120, and $180, respectively. Family C had the highest expenditure, followed by Family A and then Family B. This initial observation suggests that Family C either encountered more maintenance issues or opted for higher quality services or parts.
Body 2
In the second month, the costs increased for all three families. Family A spent $200, Family B $160, and Family C $220. Family C remained the highest spender, while Family B continued to have the lowest expenses. This upward trend in the second month indicates that maintenance costs can fluctuate significantly and may be influenced by various factors such as seasonal changes or accumulated wear and tear.
Body 3
In the third month, there was a slight decrease in expenses for all families. Family A’s costs dropped to $180, Family B’s to $140, and Family C’s to $200. Despite the reduction, Family C still incurred the highest costs, and Family B maintained the lowest. This final observation highlights that while there can be monthly variations, some families consistently spend more on car maintenance, potentially due to differences in car models, usage patterns, or maintenance practices.
In conclusion, the data reveals that Family C consistently had the highest car maintenance expenses over the three-month period, while Family B consistently had the lowest. Understanding these patterns can help families better budget for future maintenance costs and possibly explore ways to reduce them.