IELTS Writing Task 1 yêu cầu bạn mô tả biểu đồ bar chart về lượng tiêu thụ bột giặt trong 3 ngày của 3 cửa hàng khác nhau. Bạn cần phân tích sự thay đổi và so sánh mức tiêu thụ giữa các cửa hàng qua từng ngày. Chú ý sử dụng ngôn ngữ mô tả chính xác và logic, đồng thời trình bày số liệu cụ thể để minh họa rõ ràng các xu hướng và khác biệt trong biểu đồ.
Đọc bài này Cách làm bài IELTS Writing Task 1 Bar Chart trước khi làm bài.
Bạn cũng có thể đọc lại bài nói về Task 1 tại đây: IELTS Writing Task 1 cần lưu ý những gì?
Đọc thêm về xây dựng lộ trình học IELTS của The Real IELTS.
IELTS Writing Task 1 Bar Chart: Consumption
You should spent about 20 mintutes on this task
IELTS Writing Task 1 requires you to describe a bar chart showing the consumption of detergent over 3 days at 3 different stores. You need to analyze the changes and compare the consumption levels between the stores each day. Be sure to use accurate and logical descriptive language, and present specific figures to clearly illustrate the trends and differences in the chart.
You should write at least 150 words.
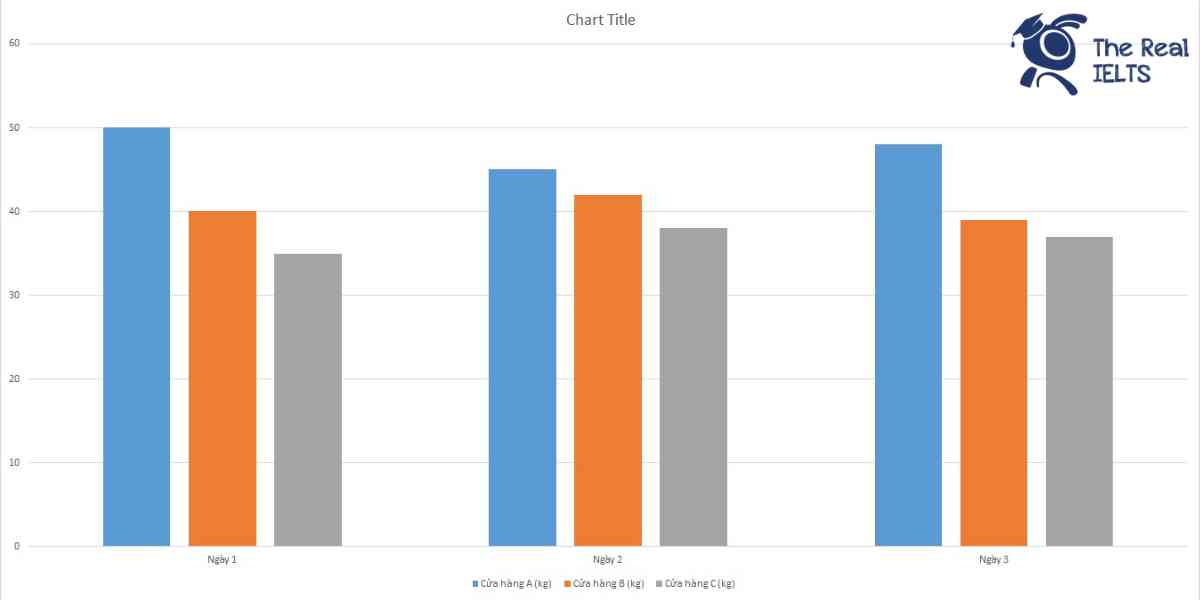
| Ngày | Cửa hàng A (kg) | Cửa hàng B (kg) | Cửa hàng C (kg) |
| Ngày 1 | 50 | 40 | 35 |
| Ngày 2 | 45 | 42 | 38 |
| Ngày 3 | 48 | 39 | 37 |

Bài mẫu 1
Overview
This report examines the detergent consumption of three different stores over a period of three days. The stores, referred to as Store A, Store B, and Store C, each reported the amount of detergent sold in kilograms daily. The data provided is hypothetical and serves to illustrate the sales trends across the three days. The analysis will highlight the variations in consumption between the stores and identify any notable patterns.
Body 1: Store A
Store A started with the highest consumption on Day 1, selling 50 kg of detergent. On Day 2, there was a noticeable decrease in sales, with the store selling 45 kg. However, on Day 3, the consumption slightly increased to 48 kg. Overall, Store A consistently maintained the highest sales among the three stores, with only a slight fluctuation in daily consumption.
Body 2: Store B and Store C
Store B showed a different trend compared to Store A. On Day 1, Store B sold 40 kg of detergent. This amount slightly increased to 42 kg on Day 2, before decreasing to 39 kg on Day 3. Store C, on the other hand, had the lowest sales on Day 1 with 35 kg. The sales increased on Day 2 to 38 kg and remained relatively stable on Day 3 at 37 kg. While Store B had a slight increase and then a decrease, Store C exhibited a steady growth followed by a slight dip.
Conclusion
In conclusion, Store A had the highest overall detergent consumption across the three days, despite a minor decrease on the second day. Store B showed a fluctuating pattern with a slight peak on the second day, and Store C demonstrated a gradual increase followed by stability. These patterns indicate different consumer behaviors and possibly varying market demands at each store.
Bài mẫu 2
Overview
The table presents data on the consumption of detergent in three different stores over a period of three days. The stores are labeled as Store A, Store B, and Store C. The consumption figures, given in kilograms, show the amount of detergent each store used daily. This statistical data provides insight into the daily usage patterns and overall consumption trends across the three stores.
Body 1
On the first day, Store A consumed the highest amount of detergent with 50 kg, followed by Store B with 40 kg, and Store C with 35 kg. This initial observation indicates that Store A had the greatest demand for detergent, while Store C had the least. The consumption differences might be attributed to the size of the stores, customer base, or other operational factors.
Body 2
The second day shows a slight change in the consumption patterns. Store A’s usage decreased to 45 kg, while Store B’s consumption increased slightly to 42 kg. Store C’s consumption also increased to 38 kg. This shift suggests a possible fluctuation in customer traffic or restocking schedules. On the third day, Store A’s consumption slightly increased to 48 kg, while Store B’s decreased to 39 kg, and Store C’s decreased marginally to 37 kg. These variations highlight the dynamic nature of daily sales and inventory management in each store.
Overall, Store A consistently had the highest detergent consumption over the three days, despite some fluctuations. Store B and Store C showed more variability, with Store C maintaining the lowest consumption throughout the period.