IELTS Writing Task 1 yêu cầu bạn phân tích và mô tả biểu đồ, dữ liệu hoặc sơ đồ đã cho. Trong trường hợp này, bạn sẽ phân tích lượng tiêu thụ mỹ phẩm trong ba ngày của ba hãng mỹ phẩm khác nhau. Biểu đồ sẽ là một Bar Chart, cho thấy sự so sánh giữa các hãng mỹ phẩm qua thời gian. Bạn sẽ cung cấp thông tin chi tiết về số liệu và xu hướng để đưa ra nhận định về sự khác biệt và xu hướng tiêu thụ của từng hãng.
Đọc bài này Cách làm bài IELTS Writing Task 1 Bar Chart trước khi làm bài.
Bạn cũng có thể đọc lại bài nói về Task 1 tại đây: IELTS Writing Task 1 cần lưu ý những gì?
Đọc thêm về xây dựng lộ trình học IELTS của The Real IELTS.
IELTS Writing Task 1 Bar Chart: Cosmetics
You should spent about 20 mintutes on this task
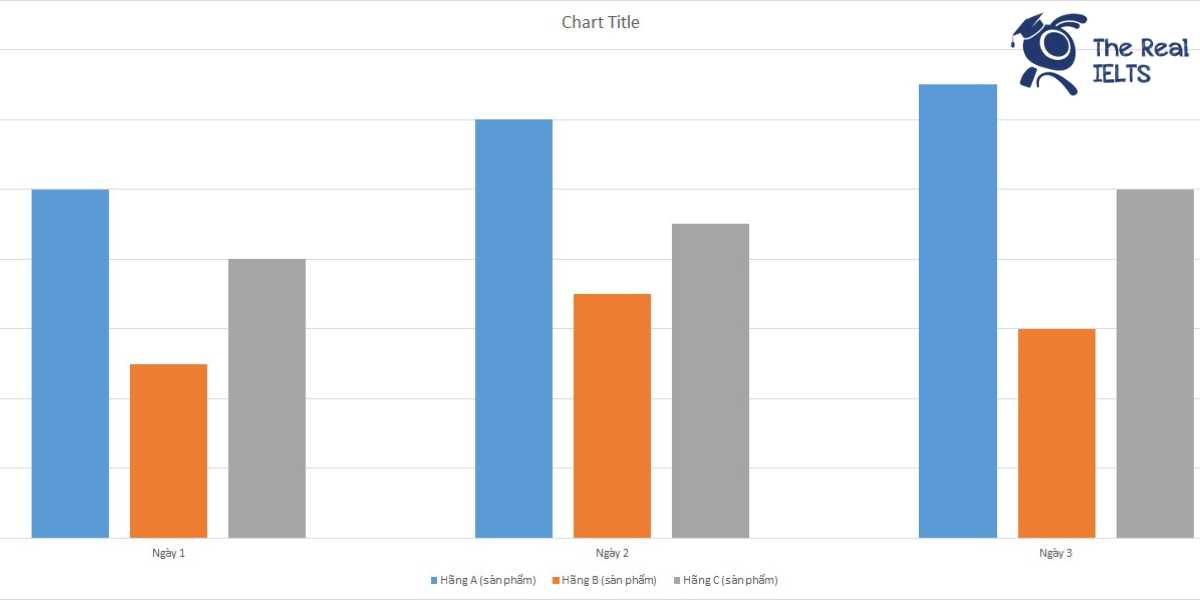
IELTS Writing Task 1 requires you to analyze and describe a given chart, data, or diagram. In this case, you will analyze the consumption of cosmetics over three days by three different cosmetic brands. The chart will be a Bar Chart, illustrating the comparison of these brands over time. You will provide detailed information about the figures and trends to make observations on the differences and consumption trends of each brand.
You should write at least 150 words.
| Ngày | Hãng A (sản phẩm) | Hãng B (sản phẩm) | Hãng C (sản phẩm) |
| Ngày 1 | 500 | 450 | 480 |
| Ngày 2 | 520 | 470 | 490 |
| Ngày 3 | 530 | 460 | 500 |

Bài mẫu 1
Overview
The cosmetic market is highly competitive, with numerous brands vying for consumer attention and loyalty. This analysis examines the sales data of three cosmetic companies—Brand A, Brand B, and Brand C—over a span of three days. By analyzing these figures, we can gain insights into their sales performance, trends, and market dynamics.
Body 1: Sales Analysis of Brand A
Brand A demonstrated a steady increase in product sales over the three-day period. Starting with 500 units sold on Day 1, the brand saw a slight increase to 520 units on Day 2, and further increased to 530 units on Day 3. This consistent upward trend indicates a growing consumer preference or successful marketing strategies. Brand A’s sales growth can be attributed to various factors such as product quality, brand reputation, promotional activities, or seasonal demand.
Body 2: Comparative Sales Performance of Brands B and C
Brand B and Brand C displayed different sales patterns compared to Brand A. Brand B’s sales started at 450 units on Day 1, peaked at 470 units on Day 2, but slightly decreased to 460 units on Day 3. This fluctuation might suggest variable consumer interest or the impact of external factors affecting sales. In contrast, Brand C’s sales showed a gradual increase, starting at 480 units on Day 1, rising to 490 units on Day 2, and reaching 500 units on Day 3. Brand C’s sales pattern indicates steady growth, similar to Brand A, but with a slower pace.
In conclusion, while Brand A and Brand C exhibited steady sales growth, Brand B’s sales fluctuated over the three days. Understanding these patterns can help companies strategize and optimize their sales approaches to better meet consumer needs and enhance market performance.
Bài mẫu 2
Overview
The cosmetic consumption statistics over a period of three days for three different brands—Brand A, Brand B, and Brand C—are presented in the table below. The data showcases the number of products sold by each brand on a daily basis. This analysis provides insights into the daily sales trends and performance of each brand, aiding in understanding their market dynamics.
Body 1: Sales Trends
On Day 1, Brand A led the sales with 500 products, followed by Brand C with 480 products, and Brand B with 450 products. This initial data indicates that Brand A had a strong market presence right from the start. Moving to Day 2, Brand A continued to increase its sales to 520 products, maintaining its lead. Brand C also showed an upward trend with sales of 490 products, while Brand B improved slightly to 470 products. By Day 3, Brand A further increased its sales to 530 products, Brand C reached 500 products, and Brand B experienced a slight decline to 460 products.
Body 2: Comparative Analysis
Analyzing the data across the three days reveals that Brand A consistently outperformed the other two brands in terms of product sales. The steady increase in sales from 500 on Day 1 to 530 on Day 3 indicates a growing demand for Brand A’s products. Brand C also exhibited a positive trend, starting from 480 on Day 1 and reaching 500 by Day 3. In contrast, Brand B showed a mixed performance. Despite an initial increase from 450 on Day 1 to 470 on Day 2, its sales declined slightly to 460 on Day 3. This fluctuation might suggest potential market challenges or competition affecting Brand B.
Overall, the data suggests that Brand A has a strong and growing market presence, Brand C is also performing well with a consistent upward trend, while Brand B needs to address the factors causing its sales variability.