IELTS Writing Task 1 yêu cầu phân tích biểu đồ cột thể hiện lượng khách hàng hàng tháng của bốn cửa hàng trong năm 2021. Nhiệm vụ là mô tả và so sánh dữ liệu giữa các cửa hàng, chú ý đến sự biến đổi theo thời gian. Người viết cần trình bày rõ ràng, chính xác và có cấu trúc hợp lý.
Đọc bài này Cách làm bài IELTS Writing Task 1 Bar Chart trước khi làm bài.
Bạn cũng có thể đọc lại bài nói về Task 1 tại đây: IELTS Writing Task 1 cần lưu ý những gì?
IELTS Writing Task 1 Bar Chart: Customers
You should spent about 20 mintutes on this task
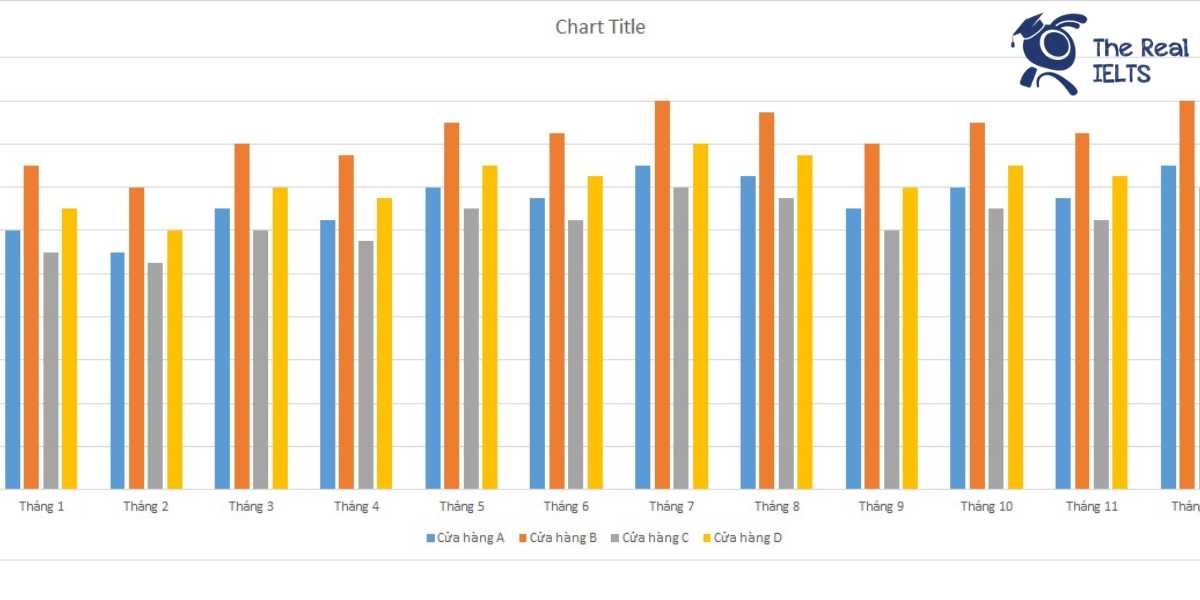
IELTS Writing Task 1 requires analyzing a bar chart showing the monthly number of customers at four stores in 2021. The task is to describe and compare the data between the stores, noting changes over time. The writer needs to present the information clearly, accurately, and in a well-organized manner.
You should write at least 150 words.
| Tháng | Cửa hàng A | Cửa hàng B | Cửa hàng C | Cửa hàng D |
| Tháng 1 | 1,200 | 1,500 | 1,100 | 1,300 |
| Tháng 2 | 1,100 | 1,400 | 1,050 | 1,200 |
| Tháng 3 | 1,300 | 1,600 | 1,200 | 1,400 |
| Tháng 4 | 1,250 | 1,550 | 1,150 | 1,350 |
| Tháng 5 | 1,400 | 1,700 | 1,300 | 1,500 |
| Tháng 6 | 1,350 | 1,650 | 1,250 | 1,450 |
| Tháng 7 | 1,500 | 1,800 | 1,400 | 1,600 |
| Tháng 8 | 1,450 | 1,750 | 1,350 | 1,550 |
| Tháng 9 | 1,300 | 1,600 | 1,200 | 1,400 |
| Tháng 10 | 1,400 | 1,700 | 1,300 | 1,500 |
| Tháng 11 | 1,350 | 1,650 | 1,250 | 1,450 |
| Tháng 12 | 1,500 | 1,800 | 1,400 | 1,600 |

Bài mẫu
Introduction
The table presents the monthly customer numbers for four stores (A, B, C, and D) throughout the year 2021. The data shows how the customer count varies across different months for each store.
Overview
Overall, Store B consistently had the highest number of customers each month, while Store C had the lowest. Customer numbers for all stores followed a similar pattern, with an increase during the mid-year months and a slight drop towards the end of the year.
Body 1
In the first half of the year, Store B saw a steady increase from 1,500 customers in January to 1,700 customers in May. Store A experienced fluctuations, starting at 1,200 customers in January, dipping to 1,100 in February, and peaking at 1,400 in May. Store C had the lowest starting point with 1,100 customers in January but saw gradual growth, reaching 1,300 customers by May. Store D followed a similar trend to Store C, starting at 1,300 customers in January and rising to 1,500 customers in May.
Body 2
In the second half of the year, all stores showed a marked increase in customer numbers in July, with Store B reaching 1,800 customers, the highest monthly figure for any store throughout the year. Store A and Store C both hit their yearly peaks in July, with 1,500 and 1,400 customers respectively. The end of the year saw a decrease in customer numbers for all stores, yet Store B maintained the highest figures, matching its July peak of 1,800 customers in December. Stores A, C, and D also saw increases in December, each reaching 1,500, 1,400, and 1,600 customers, respectively.