IELTS Writing Task 1 yêu cầu thí sinh mô tả biểu đồ bar chart về chi phí nhiên liệu trong ba tháng của ba hãng hàng không. Thí sinh cần phân tích và so sánh sự thay đổi chi phí giữa các hãng, chú ý đến các chi tiết nổi bật và xu hướng chung trong khoảng thời gian đó.
Đọc bài này Cách làm bài IELTS Writing Task 1 Bar Chart trước khi làm bài.
Bạn cũng có thể đọc lại bài nói về Task 1 tại đây: IELTS Writing Task 1 cần lưu ý những gì?
Đọc thêm về xây dựng lộ trình học IELTS của The Real IELTS.
IELTS Writing Task 1 Bar Chart: Fuel Costs
You should spent about 20 mintutes on this task
IELTS Writing Task 1 requires candidates to describe a bar chart showing fuel costs over three months for three airlines. Candidates need to analyze and compare the changes in costs between the airlines, paying attention to prominent details and overall trends during that period.
You should write at least 150 words
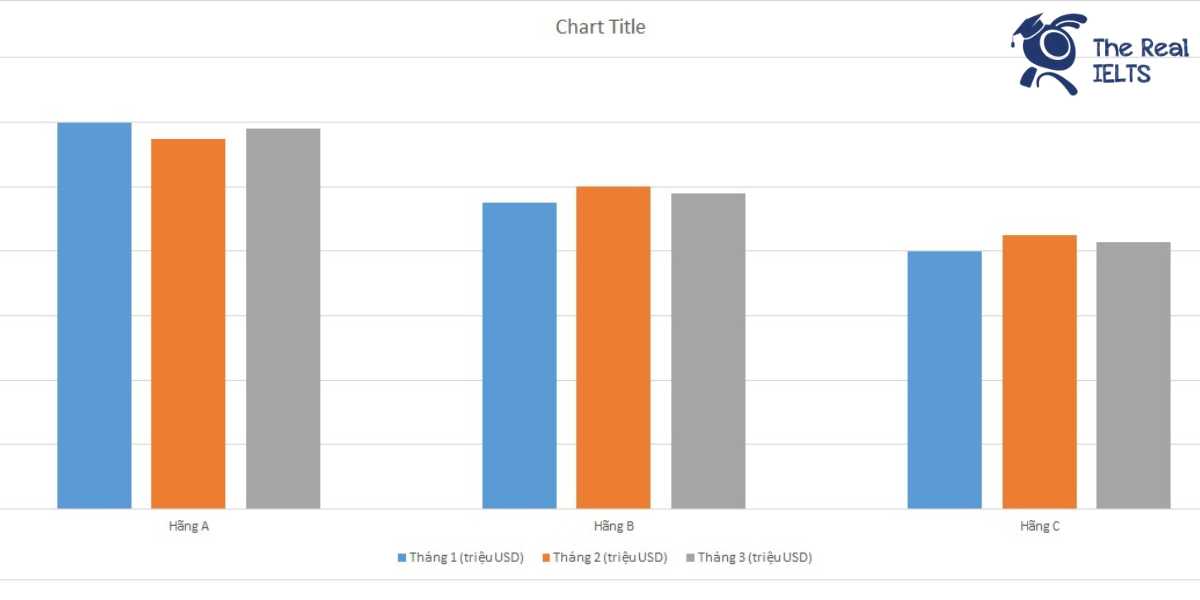
| Hãng Máy Bay | Tháng 1 (triệu USD) | Tháng 2 (triệu USD) | Tháng 3 (triệu USD) |
| Hãng A | 120 | 115 | 118 |
| Hãng B | 95 | 100 | 98 |
| Hãng C | 80 | 85 | 83 |

Bài mẫu 1
Introduction:
The table provides information about the fuel costs incurred by three airlines, namely Airline A, Airline B, and Airline C, over a three-month period.
Overview:
Overall, Airline A consistently had the highest fuel expenses each month, while Airline C had the lowest. Despite some fluctuations, the differences in fuel costs among the airlines remained relatively stable over the three months.
Body 1:
In January, Airline A spent the most on fuel, with expenses reaching 120 million USD. This figure slightly decreased to 115 million USD in February before rising again to 118 million USD in March. Airline B’s fuel costs started at 95 million USD in January, increased to 100 million USD in February, and then dropped slightly to 98 million USD in March.
Body 2:
Airline C had the lowest fuel costs among the three airlines, with expenditures of 80 million USD in January. This amount increased to 85 million USD in February and then fell slightly to 83 million USD in March. While Airline A consistently had the highest fuel costs, the monthly differences among all three airlines were relatively modest, showing a stable pattern in their fuel expenditures over the period.
Bài mẫu 2
Introduction
The table presents the fuel expenditure of three airlines (A, B, and C) over a three-month period, specifically January, February, and March, measured in million USD.
Overview
Overall, Airline A consistently had the highest fuel costs among the three, while Airline C had the lowest. Notably, the fuel expenditure for all airlines demonstrated slight fluctuations over the given months.
Body 1
Airline A’s fuel costs started at 120 million USD in January, experienced a decrease to 115 million USD in February, and slightly rose again to 118 million USD in March. Despite these minor changes, Airline A maintained the highest fuel expenditure throughout the three months.
Body 2
Airline B’s fuel costs displayed a different pattern. Beginning at 95 million USD in January, the costs increased to 100 million USD in February before slightly declining to 98 million USD in March. In comparison, Airline C had the lowest fuel costs, starting at 80 million USD in January, increasing to 85 million USD in February, and then slightly decreasing to 83 million USD in March. This trend indicates that Airline C consistently spent the least on fuel among the three airlines.
Bài mẫu 3
Introduction:
The table illustrates the fuel expenses of three airlines (Airline A, Airline B, and Airline C) over a period of three months.
Overview:
Overall, it is evident that Airline A consistently had the highest fuel expenses each month, whereas Airline C had the lowest. Despite minor fluctuations, all three airlines showed a relatively stable trend in their fuel costs over the three-month period.
Body 1:
In January, Airline A’s fuel expenses were the highest at 120 million USD, followed by Airline B at 95 million USD, and Airline C at 80 million USD. In February, the fuel costs for Airline A decreased slightly to 115 million USD, while Airline B’s expenses increased to 100 million USD. Airline C also experienced a rise in fuel costs, reaching 85 million USD.
Body 2:
In March, there was a slight increase in fuel expenses for Airline A, bringing the total to 118 million USD. Airline B’s costs decreased marginally to 98 million USD. Similarly, Airline C’s fuel expenses reduced slightly to 83 million USD. Throughout the three months, Airline A consistently spent the most on fuel, while Airline C remained the airline with the lowest fuel expenses.