IELTS Writing Task 1 yêu cầu thí sinh miêu tả biểu đồ Bar Chart về tỷ lệ thất thoát hàng hóa trong 3 tháng của ba xưởng sản xuất. Người viết cần phân tích và so sánh dữ liệu, chỉ ra xu hướng chính và sự khác biệt giữa các xưởng, cung cấp cái nhìn tổng quan và chi tiết cụ thể.
Đọc bài này Cách làm bài IELTS Writing Task 1 Bar Chart trước khi làm bài.
Bạn cũng có thể đọc lại bài nói về Task 1 tại đây: IELTS Writing Task 1 cần lưu ý những gì?
Đọc thêm về xây dựng lộ trình học IELTS của The Real IELTS.
IELTS Writing Task 1 Bar Chart: Goods Loss
You should spent about 20 mintutes on this task
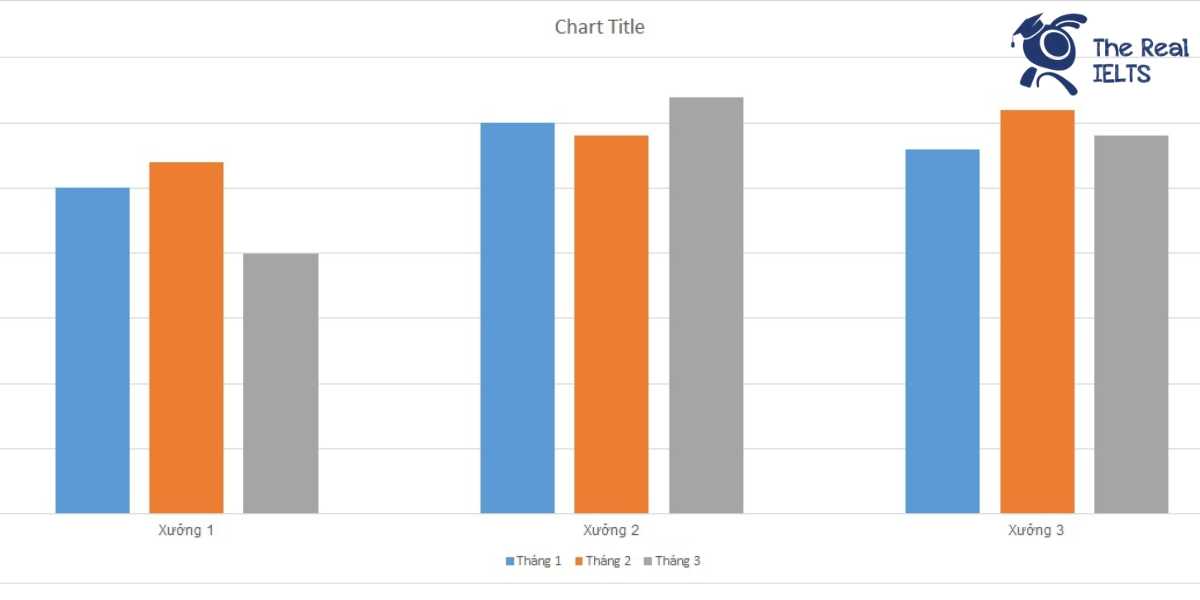
IELTS Writing Task 1 requires candidates to describe a Bar Chart showing the rate of goods loss over 3 months across three manufacturing plants. The writer needs to analyze and compare the data, highlight key trends and differences between the plants, and provide an overall view with specific details.
You should write at least 150 words
| Tháng | Xưởng 1 | Xưởng 2 | Xưởng 3 |
| Tháng 1 | 2.5 | 3 | 2.8 |
| Tháng 2 | 2.7 | 2.9 | 3.1 |
| Tháng 3 | 2 | 3.2 | 2.9 |

Bài mẫu 1
Introduction: The table illustrates the percentage of goods lost during the production process over a three-month period (January to March) in three different manufacturing plants.
Overview: Overall, the percentage of goods lost varied slightly across the three months and among the three plants. Plant 2 experienced the highest fluctuation in loss rates, while Plant 1 maintained relatively stable figures.
Body 1: In January, Plant 2 had the highest loss rate at 3.0%, followed closely by Plant 3 at 2.8% and Plant 1 at 2.5%. In February, the loss rate for Plant 2 decreased slightly to 2.9%, whereas Plant 1 and Plant 3 saw a slight increase to 2.7% and 3.1%, respectively. Notably, Plant 3 had the highest loss rate in February.
Body 2: In March, Plant 2’s loss rate increased again to 3.2%, making it the highest for that month, while Plant 1’s rate decreased to 2.6%. Plant 3’s loss rate decreased slightly to 2.9%. Throughout the three months, Plant 1 had the most consistent performance, with loss rates fluctuating minimally between 2.5% and 2.7%. Conversely, Plant 2 exhibited the greatest variability, with rates ranging from 2.9% to 3.2%.
Overall, while the loss rates did not show significant deviations, Plant 2 consistently exhibited higher fluctuations compared to the other two plants.
Bài mẫu 2
Introduction: The table provides data on the percentage of goods lost over a three-month period for three different manufacturing plants.
Overview: Overall, it is evident that the loss rates fluctuated slightly for all three plants throughout the period. While each plant experienced some changes, no significant upward or downward trends are apparent, with the percentages remaining relatively stable.
Body 1: In January, Plant 1 reported a loss rate of 2.5%, the lowest among the three plants. Plant 2 had the highest loss rate at 3.0%, and Plant 3 recorded a rate of 2.8%. In February, there was a slight increase in the loss rates for Plant 1 and Plant 3, with Plant 1 rising to 2.7% and Plant 3 increasing to 3.1%. Conversely, Plant 2 saw a marginal decrease in its loss rate to 2.9%.
Body 2: In March, Plant 1’s loss rate decreased slightly to 2.6%, while Plant 2’s rate increased to 3.2%, the highest for that month among the three plants. Plant 3’s loss rate saw a slight decline to 2.9%. Despite these minor fluctuations, the loss rates for each plant remained relatively close to their initial percentages from January, indicating consistent performance across the three-month period.
Bài mẫu 3
Introduction
The table illustrates the percentage of product loss in three manufacturing plants over a period of three months.
Overview
Overall, the percentage of product loss fluctuated slightly in all three plants. While Plant 2 experienced a general increase over the three months, Plants 1 and 3 showed more stability with minor fluctuations.
Body 1
In January, Plant 1 reported a product loss rate of 2.5%, which was the lowest among the three plants for that month. Plant 2 had the highest loss rate in January at 3.0%, whereas Plant 3 stood in between with a rate of 2.8%. In February, the product loss rate for Plant 1 increased marginally to 2.7%, while Plant 2 experienced a slight decrease to 2.9%. However, Plant 3 saw a rise in its loss rate to 3.1%, making it the highest for that month.
Body 2
In March, Plant 1’s product loss rate decreased slightly to 2.6%. On the other hand, Plant 2 saw an increase to 3.2%, the highest rate across all plants and months. Plant 3’s loss rate decreased marginally to 2.9%, the same as its January rate. Despite these fluctuations, the variations in product loss rates were relatively minor across the three plants and months.
Summary
To summarize, the data reveals that Plant 2 consistently had higher loss rates than Plant 1 and Plant 3, except in February when Plant 3 had the highest rate. Overall, the fluctuations in product loss rates were not substantial over the three-month period.