IELTS Writing Task 1 yêu cầu mô tả biểu đồ Bar Chart về chi phí sinh hoạt trong 3 tháng của 3 gia đình. Biểu đồ này minh họa sự chênh lệch trong chi tiêu hàng tháng của mỗi gia đình, bao gồm các khoản như tiền thuê nhà, thực phẩm, và các chi phí khác. Người viết cần phân tích và so sánh dữ liệu một cách rõ ràng và logic.
Đọc bài này Cách làm bài IELTS Writing Task 1 Bar Chart trước khi làm bài.
Bạn cũng có thể đọc lại bài nói về Task 1 tại đây: IELTS Writing Task 1 cần lưu ý những gì?
Đọc thêm về xây dựng lộ trình học IELTS của The Real IELTS.
IELTS Writing Task 1 Bar Chart: Living Expenses
You should spent about 20 mintutes on this task
IELTS Writing Task 1 requires describing a Bar Chart depicting the living expenses over three months of three families. This chart illustrates the differences in monthly spending for each family, including costs such as rent, food, and other expenses. The writer needs to analyze and compare the data clearly and logically.
You should write at least 150 words
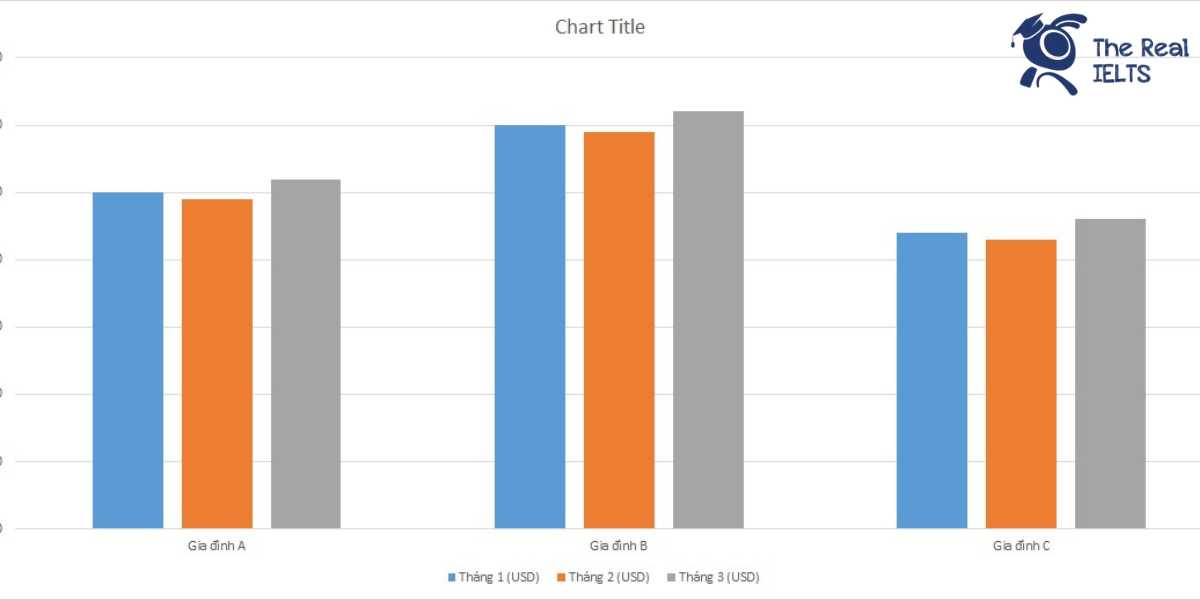
| Gia đình | Tháng 1 (USD) | Tháng 2 (USD) | Tháng 3 (USD) |
| Gia đình A | 2,5 | 2,45 | 2,6 |
| Gia đình B | 3 | 2,95 | 3,1 |
| Gia đình C | 2,2 | 2,15 | 2,3 |

Bài mẫu 1
Introduction:
The table presents the living expenses of three families (A, B, and C) over a period of three months, providing figures for January, February, and March in USD.
Overview:
Overall, Family B consistently had the highest living expenses each month, while Family C had the lowest. Despite minor fluctuations, the general trend indicates a slight increase in expenses from January to March for all families.
Body 1:
Family A’s expenses showed a slight decline from January to February, dropping from $2,500 to $2,450. However, in March, their expenses increased to $2,600, the highest among the three months. This fluctuation suggests varying costs or spending patterns, but the overall change from January to March was an increase of $100.
Body 2:
Family B consistently spent more than the other two families. Their expenses were $3,000 in January, slightly decreasing to $2,950 in February, and then rising to $3,100 in March. This pattern indicates a minimal fluctuation, ending with the highest expenditure among all families in March. Similarly, Family C had the lowest expenses, starting at $2,200 in January, decreasing to $2,150 in February, and increasing to $2,300 in March. This family also experienced minor variations but ended with a $100 increase over the three months.
Bài mẫu 2
Introduction: The table illustrates the living expenses of three families (A, B, and C) over three months: January, February, and March, with the amounts measured in USD.
Overview: Overall, Family B consistently has the highest living expenses, while Family C has the lowest throughout the three months. All three families show some fluctuations in their expenses, with the most notable changes occurring between February and March.
Body 1: In January, Family A’s expenses are $2,500, which decrease slightly to $2,450 in February before rising to $2,600 in March. Family B starts with $3,000 in January, drops to $2,950 in February, and then increases to $3,100 in March, maintaining the highest expenditure among the three families throughout the period.
Body 2: Family C has the lowest expenses, beginning with $2,200 in January, decreasing slightly to $2,150 in February, and then increasing to $2,300 in March. The fluctuations in Family C’s expenses are less pronounced compared to the other families, indicating more stable spending habits over the three months.