IELTS Writing Task 1 yêu cầu phân tích biểu đồ cột thể hiện số lượng khách hàng thân thiết trong 3 tháng tại 3 cửa hàng khác nhau. Biểu đồ này cung cấp dữ liệu so sánh giữa các cửa hàng và cho thấy xu hướng thay đổi qua từng tháng. Người viết cần mô tả rõ ràng sự khác biệt về số lượng khách hàng, nhận xét về sự tăng giảm và đưa ra phân tích chi tiết về dữ liệu biểu đồ.
Đọc bài này Cách làm bài IELTS Writing Task 1 Bar Chart trước khi làm bài.
Bạn cũng có thể đọc lại bài nói về Task 1 tại đây: IELTS Writing Task 1 cần lưu ý những gì?
Đọc thêm về xây dựng lộ trình học IELTS của The Real IELTS.
IELTS Writing Task 1 Bar Chart: Loyal Customers
You should spent about 20 mintutes on this task
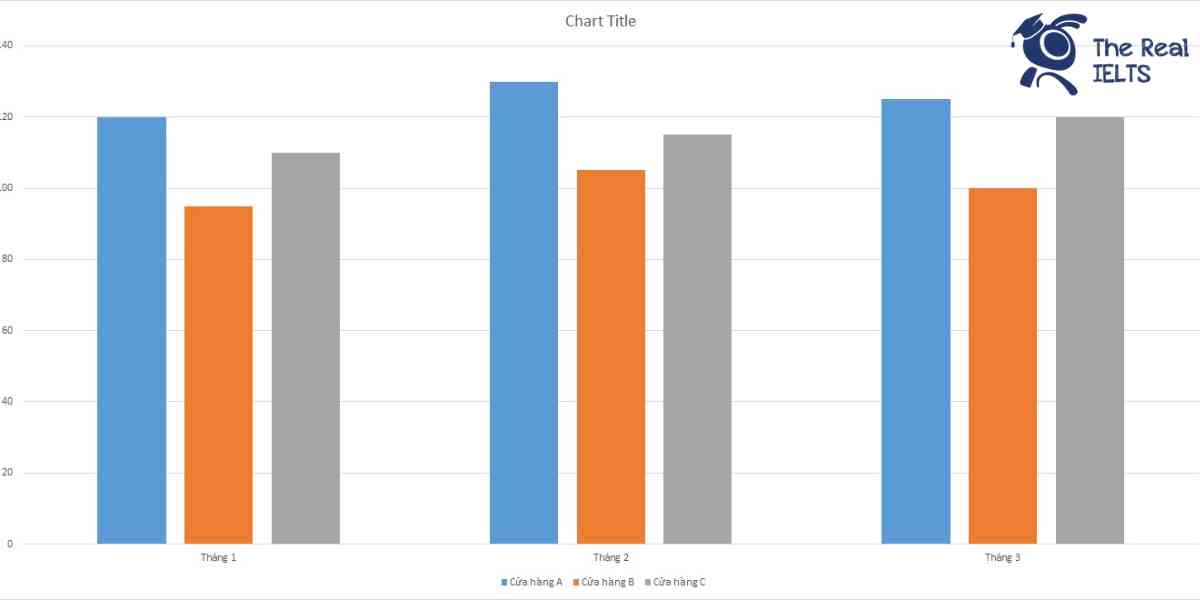
IELTS Writing Task 1 requires analyzing a bar chart showing the number of loyal customers over 3 months at 3 different stores. This chart provides comparative data between the stores and shows trends over each month. The writer needs to clearly describe the differences in customer numbers, comment on the increases and decreases, and provide a detailed analysis of the chart data.
You should write at least 150 words.
| Tháng | Cửa hàng A | Cửa hàng B | Cửa hàng C |
| Tháng 1 | 120 | 95 | 110 |
| Tháng 2 | 130 | 105 | 115 |
| Tháng 3 | 125 | 100 | 120 |

Bài mẫu 1
Overview
The table presents the number of loyal customers in three different stores (A, B, and C) over a span of three months. By examining this data, we can gain insights into the performance and customer retention capabilities of each store.
Body 1
In January, Store A led with 120 loyal customers, followed by Store C with 110, and Store B with 95. This initial data sets the baseline for understanding each store’s customer base. Store A’s higher numbers suggest a stronger start compared to the others. Store B, with the lowest count, indicates potential areas for improvement in customer loyalty.
Body 2
The subsequent months show interesting trends. In February, all stores saw an increase in loyal customers. Store A continued to lead, increasing to 130 customers. Store B experienced a notable rise to 105, while Store C also grew to 115. By March, the dynamics shifted slightly. Store A saw a slight decrease to 125 customers, whereas Store C increased to 120, closing the gap with Store A. Store B remained consistent with a minor drop to 100. These trends suggest that while Store A remains the leader, Store C is rapidly catching up, and Store B, despite improvements, still lags behind.
In summary, Store A maintains a strong customer base, Store C shows consistent growth, and Store B, though improving, needs to enhance its customer retention strategies.
Bài mẫu 2
Overview
The table provides a statistical overview of the number of loyal customers over a three-month period for three different stores: Store A, Store B, and Store C. The data shows the monthly changes in customer loyalty, offering insights into the performance and customer retention capabilities of each store.
Body 1
In January, Store A had the highest number of loyal customers with 120, followed by Store C with 110, and Store B with 95. This initial month sets a benchmark for understanding the growth or decline in the subsequent months. By February, Store A saw an increase to 130 loyal customers, indicating a growth of 10 customers. Store B also experienced growth, albeit smaller, with an increase of 10 customers, reaching 105. Store C had a modest increase, adding 5 more customers to reach a total of 115.
Body 2
March data reveals a slight decline for Store A, which dropped to 125 loyal customers, down by 5 from the previous month but still higher than January’s figure. Store B also saw a decrease, with the number of loyal customers falling to 100, a reduction of 5 from February. In contrast, Store C showed consistent growth throughout the three months, reaching 120 loyal customers in March, marking an increase of 5 from February. This trend suggests that Store C had the most consistent customer loyalty growth over the observed period.
In summary, while Store A had the highest number of loyal customers overall, Store C demonstrated steady growth, and Store B experienced a slight decline after an initial increase.