IELTS Writing Task 1 yêu cầu phân tích biểu đồ Bar Chart thể hiện lượng tiêu thụ điện thoại di động của ba hãng trong ba tháng. Người viết cần so sánh doanh số của các hãng qua từng tháng, nêu bật xu hướng chung, sự thay đổi hoặc biến động trong doanh số, và rút ra kết luận phù hợp.
Đọc bài này Cách làm bài IELTS Writing Task 1 Bar Chart trước khi làm bài.
Bạn cũng có thể đọc lại bài nói về Task 1 tại đây: IELTS Writing Task 1 cần lưu ý những gì?
Đọc thêm về xây dựng lộ trình học IELTS của The Real IELTS.
IELTS Writing Task 1 Bar Chart: Mobile Phone
You should spent about 20 mintutes on this task
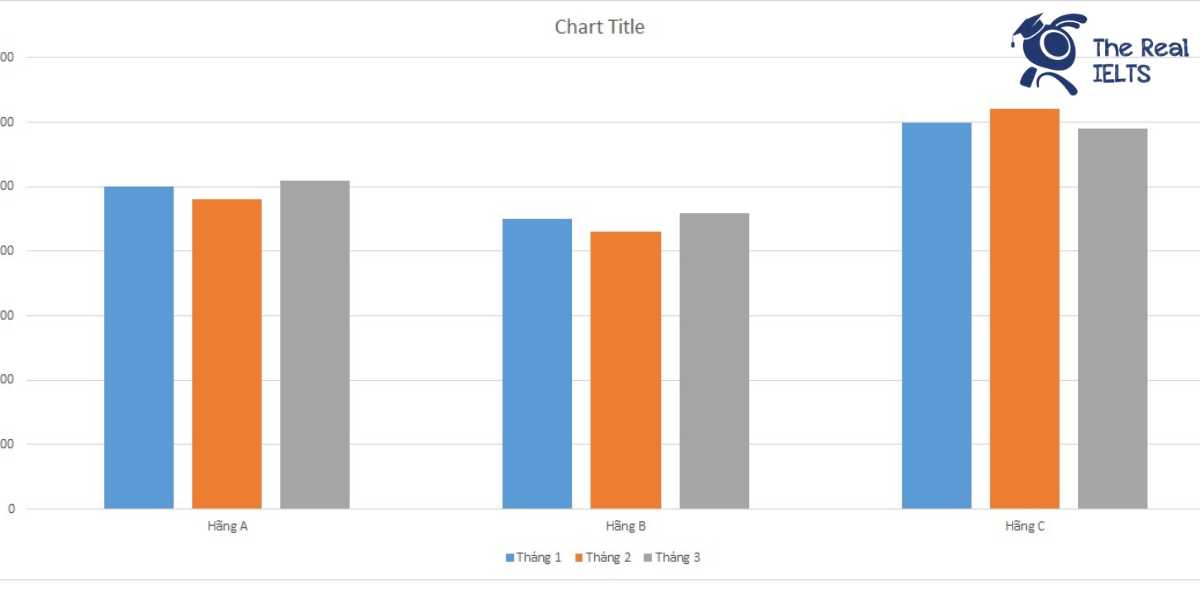
IELTS Writing Task 1 requires analyzing a Bar Chart showing the mobile phone consumption of three companies over three months. The writer needs to compare the sales of the companies month by month, highlight general trends, changes, or fluctuations in sales, and draw appropriate conclusions.
You should write at least 150 words
| Tháng/Nhãn hiệu | Hãng A | Hãng B | Hãng C |
| Tháng 1 | 500,000 | 450,000 | 600,000 |
| Tháng 2 | 480,000 | 430,000 | 620,000 |
| Tháng 3 | 510,000 | 460,000 | 590,000 |

Bài mẫu 1
Introduction: The table presents data on the consumption of mobile phones by three different brands (A, B, and C) over a three-month period.
Overview: Overall, Brand C consistently had the highest consumption figures across all three months, while Brand B had the lowest. Brand A experienced a slight fluctuation in its consumption numbers, whereas Brand B showed a steady increase.
Body 1: In January, Brand A sold 500,000 units, while Brand B and Brand C sold 450,000 and 600,000 units respectively. In February, the consumption of Brand A decreased to 480,000 units, Brand B also saw a decrease to 430,000 units, and Brand C increased to 620,000 units.
Body 2: By March, Brand A’s consumption rose to 510,000 units, marking the highest figure for this brand over the three months. Brand B experienced an increase to 460,000 units. Conversely, Brand C saw a decrease to 590,000 units, which was still higher than both Brand A and Brand B. Overall, Brand C remained the most consumed brand throughout the period despite the decrease in March.
Bài mẫu 2
Introduction
The table provides information on the consumption of mobile phones by three different brands, A, B, and C, over the course of three months: January, February, and March.
Overview
Overall, Brand C consistently had the highest consumption each month, while Brand B had the lowest. There were fluctuations in the consumption figures for all three brands over the three-month period.
Body 1
In January, Brand C led with 600,000 units sold, followed by Brand A with 500,000 units, and Brand B with 450,000 units. Moving into February, Brand C saw an increase in consumption to 620,000 units, maintaining its leading position. Meanwhile, Brand A experienced a slight decline to 480,000 units, and Brand B also saw a decrease to 430,000 units.
Body 2
In March, Brand A and Brand B both experienced growth, with Brand A rising to 510,000 units and Brand B reaching 460,000 units. On the other hand, Brand C’s consumption decreased to 590,000 units, though it remained the highest among the three brands.
Conclusion
In conclusion, while Brand C consistently held the top spot in mobile phone consumption throughout the three months, both Brands A and B showed varying trends with slight fluctuations, indicating a competitive market environment.