IELTS Writing Task 1 yêu cầu mô tả lượng tiêu thụ sách báo trong 3 tuần của ba thành phố dựa trên biểu đồ thanh (Bar Chart). Biểu đồ hiển thị số lượng sách báo được tiêu thụ tại từng thành phố, cho thấy xu hướng tiêu thụ và sự khác biệt giữa các tuần. Người viết cần phân tích và so sánh dữ liệu.
Đọc bài này Cách làm bài IELTS Writing Task 1 Bar Chart trước khi làm bài.
Bạn cũng có thể đọc lại bài nói về Task 1 tại đây: IELTS Writing Task 1 cần lưu ý những gì?
Đọc thêm về xây dựng lộ trình học IELTS của The Real IELTS.
IELTS Writing Task 1 Bar Chart: Newspapers
You should spent about 20 mintutes on this task
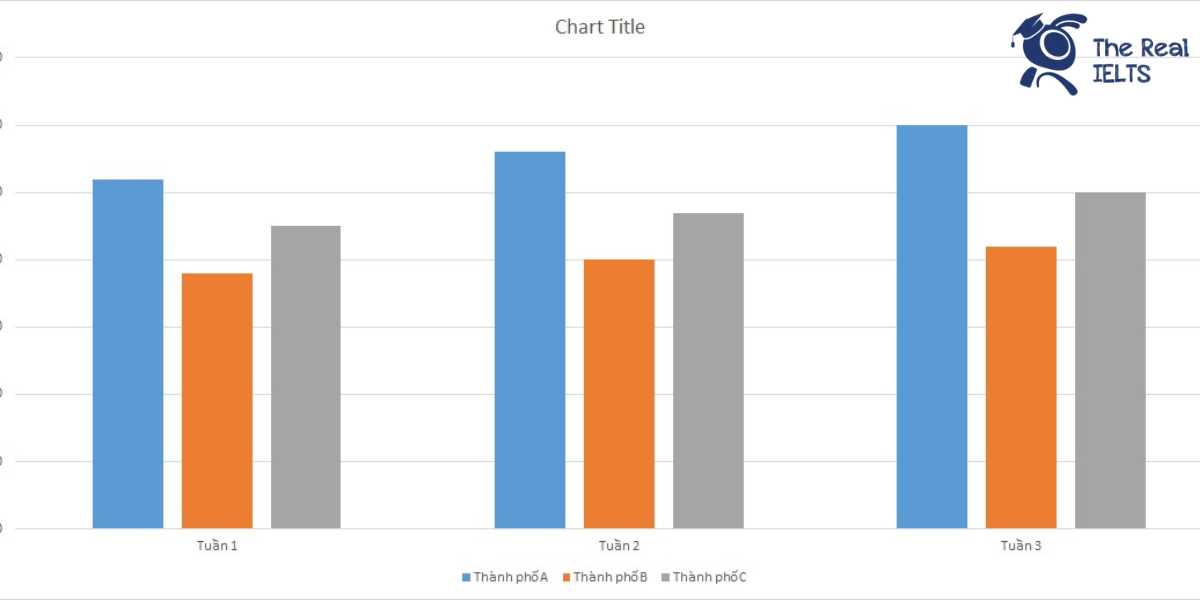
IELTS Writing Task 1 requires describing the consumption of books and newspapers over 3 weeks in three cities based on a bar chart. The chart displays the number of books and newspapers consumed in each city, showing consumption trends and differences between the weeks. The writer needs to analyze and compare the data.
You should write at least 150 words
| Tuần | Thành phố A | Thành phố B | Thành phố C |
| Tuần 1 | 5,200 | 3,800 | 4,500 |
| Tuần 2 | 5,600 | 4,000 | 4,700 |
| Tuần 3 | 6,000 | 4,200 | 5,000 |

Bài mẫu 1
Introduction
The table provides data on the consumption of books and newspapers over a period of three weeks in three hypothetical cities: City A, City B, and City C.
Overview
Overall, it is evident that the consumption of books and newspapers increased steadily in all three cities over the given period. City A consistently had the highest consumption rates, while City B had the lowest.
Body 1
In the first week, City A consumed 5,200 units, followed by City C with 4,500 units, and City B with 3,800 units. In the second week, the consumption in City A rose to 5,600 units, showing an increase of 400 units. Similarly, City C saw an increase to 4,700 units, while City B’s consumption rose modestly to 4,000 units.
Body 2
By the third week, the upward trend continued. City A reached a peak consumption of 6,000 units. City C also experienced a significant rise, reaching 5,000 units. City B’s consumption, although the lowest among the three cities, also increased steadily to 4,200 units. The consistent growth in all three cities indicates a rising interest in books and newspapers over the three-week period.
Bài mẫu 2
Introduction
The table presents data on the consumption of newspapers and books over a three-week period in three hypothetical cities: City A, City B, and City C.
Overview
Overall, City A consistently had the highest consumption of books and newspapers, followed by City C and then City B. There was a noticeable upward trend in the consumption across all cities over the three weeks.
Body 1
In the first week, City A led with 5,200 units, significantly higher than City B’s 3,800 units and City C’s 4,500 units. The second week saw an increase in all cities, with City A rising to 5,600 units, City B to 4,000 units, and City C to 4,700 units.
Body 2
By the third week, City A’s consumption peaked at 6,000 units, marking the largest increase among the three cities. City B continued its gradual rise, reaching 4,200 units. City C also saw a steady increase, ending the third week with 5,000 units. This consistent growth highlights a uniform increase in interest in reading materials across all three cities.