IELTS Writing Task 1 yêu cầu mô tả biểu đồ Bar Chart về lượng mưa trung bình hàng năm từ năm 2011 đến 2013 của bốn thành phố. Thí sinh cần phân tích và so sánh số liệu, nêu bật sự khác biệt, xu hướng và bất kỳ biến động nào giữa các thành phố qua từng năm, sử dụng ngôn từ chính xác và mạch lạc.
Đọc bài này Cách làm bài IELTS Writing Task 1 Bar Chart trước khi làm bài.
Bạn cũng có thể đọc lại bài nói về Task 1 tại đây: IELTS Writing Task 1 cần lưu ý những gì?
IELTS Writing Task 1 Bar Chart: Rainfall
You should spent about 20 mintutes on this task
IELTS Writing Task 1 requires describing a Bar Chart showing the average annual rainfall from 2011 to 2013 for four cities. Candidates need to analyze and compare the data, highlighting differences, trends, and any fluctuations among the cities over the years, using precise and coherent language.
You should write at least 150 words.
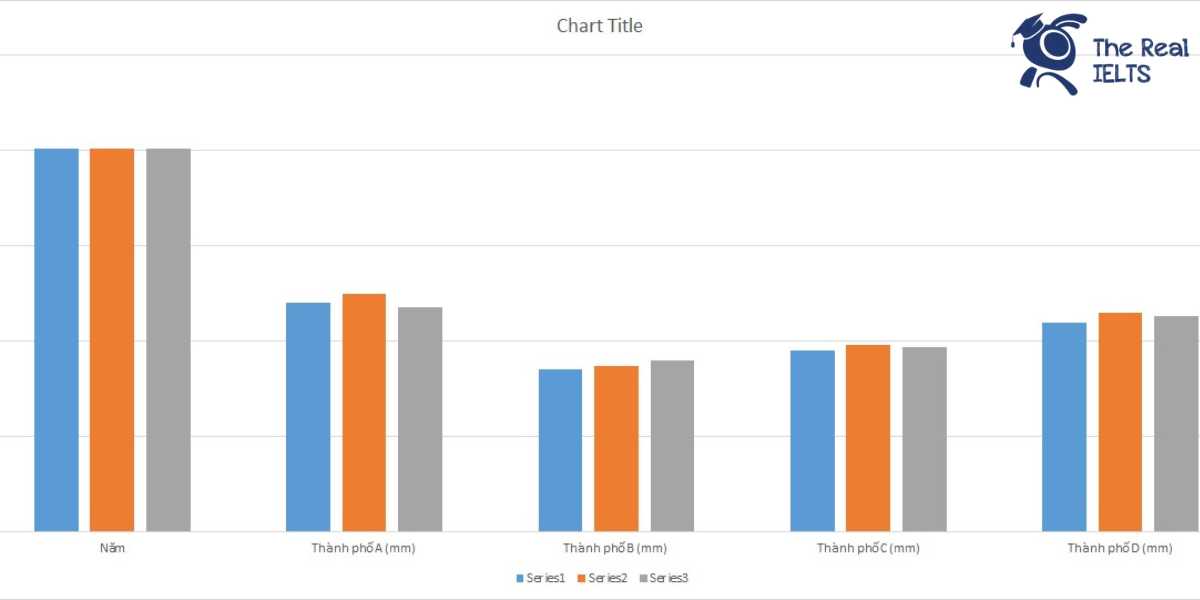
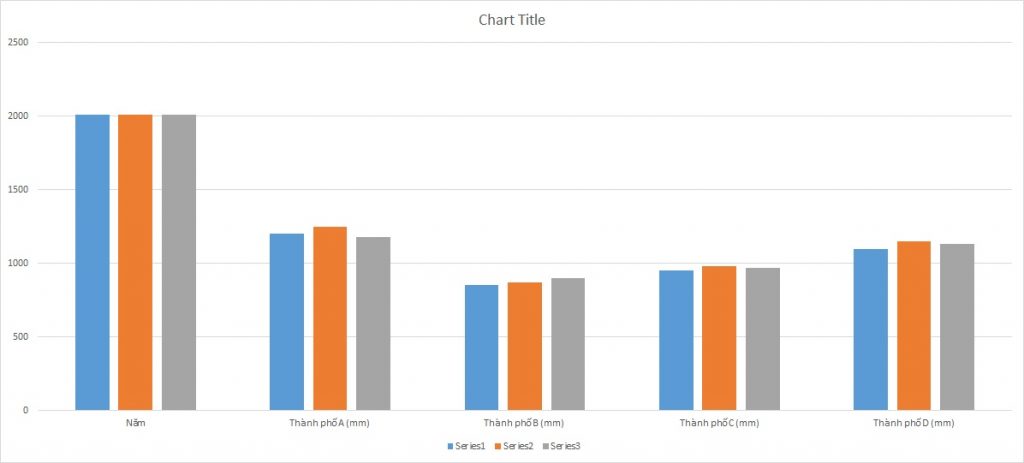
| Năm | Thành phố A (mm) | Thành phố B (mm) | Thành phố C (mm) | Thành phố D (mm) |
| 2011 | 1200 | 850 | 950 | 1100 |
| 2012 | 1250 | 870 | 980 | 1150 |
| 2013 | 1180 | 900 | 970 | 1130 |
Bài mẫu 1
Introduction
The table illustrates the annual average rainfall (in millimeters) for four cities (City A, City B, City C, and City D) over a three-year period from 2011 to 2013.
Overview
Overall, City A consistently received the highest amount of rainfall each year, while City B had the lowest annual rainfall on average. All cities experienced slight fluctuations in their rainfall amounts over the given period.
Body 1
In 2011, City A recorded 1200 mm of rainfall, making it the city with the highest precipitation that year. City D followed with 1100 mm, while City C and City B had 950 mm and 850 mm, respectively. By 2012, City A’s rainfall increased to 1250 mm, maintaining its lead. City D also saw an increase to 1150 mm, and City C’s rainfall rose to 980 mm. City B had a marginal increase to 870 mm, remaining the city with the least rainfall.
Body 2
In 2013, there was a slight decline in the rainfall for most cities. City A’s rainfall dropped to 1180 mm but continued to be the highest among the four cities. City B’s rainfall rose to 900 mm, its highest in the given period. City C experienced a minor decrease to 970 mm, and City D saw a slight drop to 1130 mm. Despite these fluctuations, the overall trend shows City A consistently receiving the most rainfall and City B the least.
Conclusion
In conclusion, while City A consistently had the highest average annual rainfall from 2011 to 2013, City B had the lowest. The rainfall patterns for all cities showed minor fluctuations over the three years, but no drastic changes occurred.
Bài mẫu 2
Introduction
The table illustrates the average annual rainfall (in millimeters) in four cities (A, B, C, and D) over three years from 2011 to 2013.
Overview
Overall, City A consistently received the highest amount of rainfall each year, while City B had the lowest. All cities experienced fluctuations in their annual rainfall, with City C and City D showing a slight upward trend over the three-year period.
Body 1
In 2011, City A received the highest rainfall at 1200 mm, followed by City D with 1100 mm. City C and City B received 950 mm and 850 mm, respectively. In 2012, City A’s rainfall increased to 1250 mm, remaining the highest among the four cities. City D also saw an increase to 1150 mm, while City C’s rainfall rose to 980 mm. City B had a modest increase to 870 mm.
Body 2
In 2013, City A’s rainfall decreased slightly to 1180 mm but still led the group. City B’s rainfall continued to rise, reaching 900 mm. City C experienced a minor decrease to 970 mm, and City D’s rainfall fell slightly to 1130 mm. Despite these variations, the overall trend shows City A consistently receiving the most rainfall, and City B the least, with the other cities falling in between.
Bài mẫu 3
Introduction
The table provides information about the average annual rainfall from 2011 to 2013 in four cities: City A, City B, City C, and City D.
Overview
Overall, during this period, the rainfall in City A and City D showed a decreasing trend, while City B and City C experienced a slight increase. City A had the highest rainfall in all years, while City B had the lowest.
Body 1
In 2011, the average rainfall in City A reached its highest at 1200 mm, followed by City D with 1100 mm. City C ranked third with 950 mm, and City B had the lowest rainfall at 850 mm. By 2012, the rainfall in City A slightly increased to 1250 mm, while City D also saw an increase to 1150 mm. City C and City B also experienced increases in rainfall, reaching 980 mm and 870 mm respectively.
Body 2
However, 2013 witnessed a decline in rainfall in City A and City D, with levels dropping to 1180 mm and 1130 mm respectively. On the other hand, City B and City C continued to see slight increases, reaching 900 mm and 970 mm respectively. Despite this, City A maintained the highest rainfall levels over the three years, while City B consistently had the lowest compared to the other cities.
Conclusion
In conclusion, the average annual rainfall of these cities shows significant variation, with a decreasing trend in City A and City D, while City B and City C experienced slight increases over the years.
Bài mẫu 4
The table illustrates the average annual rainfall (in millimeters) in four cities—City A, City B, City C, and City D—from 2011 to 2013.
Overall, City A consistently received the highest rainfall over the three-year period, while City B had the lowest. All cities showed fluctuations in rainfall, with most cities experiencing an increase in 2012 before a slight decline in 2013.
In detail, City A had the highest rainfall each year, with 1200 mm in 2011, peaking at 1250 mm in 2012, and then dropping to 1180 mm in 2013. City B consistently recorded the lowest rainfall, starting at 850 mm in 2011, increasing to 870 mm in 2012, and reaching 900 mm in 2013.
City C’s rainfall figures were relatively stable, beginning at 950 mm in 2011, rising to 980 mm in 2012, and slightly decreasing to 970 mm in 2013. City D experienced a steady increase from 1100 mm in 2011 to 1150 mm in 2012, followed by a minor reduction to 1130 mm in 2013.
In conclusion, while City A had the highest rainfall and City B the lowest, all cities showed similar trends of increased rainfall in 2012 followed by a small decrease in 2013.
Bài mẫu 5
Introduction
The table illustrates the average annual rainfall in millimeters for four cities—City A, City B, City C, and City D—over the period from 2011 to 2013.
Overview
Overall, all four cities experienced fluctuations in their annual rainfall during the three-year period. City A had the highest rainfall in most years, whereas City B consistently had the lowest.
Body 1
In 2011, City A received the highest amount of rainfall at 1200 mm, followed by City D with 1100 mm. City C and City B had lower amounts, with 950 mm and 850 mm respectively. In the following year, 2012, rainfall increased across all cities. City A’s rainfall peaked at 1250 mm, City D’s at 1150 mm, City C’s at 980 mm, and City B’s at 870 mm.
Body 2
By 2013, rainfall figures showed a slight decline for most cities except City B, which saw an increase to 900 mm. City A’s rainfall decreased to 1180 mm, City C’s to 970 mm, and City D’s to 1130 mm. Despite these variations, City A consistently recorded the highest rainfall, while City B remained the city with the least rainfall throughout the three years.
Overall, the data indicates that while there were fluctuations in the annual rainfall amounts for each city, the relative rankings of the cities in terms of rainfall amounts remained largely unchanged.