IELTS Writing Task 1 yêu cầu mô tả biểu đồ cột thể hiện doanh thu theo loại sản phẩm trong ba tháng của ba cửa hàng khác nhau. Nhiệm vụ này đòi hỏi phân tích và so sánh dữ liệu để làm rõ sự khác biệt và xu hướng doanh thu giữa các loại sản phẩm và cửa hàng.
Đọc bài này Cách làm bài IELTS Writing Task 1 Bar Chart trước khi làm bài.
Bạn cũng có thể đọc lại bài nói về Task 1 tại đây: IELTS Writing Task 1 cần lưu ý những gì?
IELTS Writing Task 1 Bar Chart: Revenue Product
You should spent about 20 mintutes on this task
IELTS Writing Task 1 requires describing a bar chart showing revenue by product type over three months for three different stores. This task involves analyzing and comparing the data to clarify the differences and trends in revenue among the product types and stores.
You should write at least 150 words.
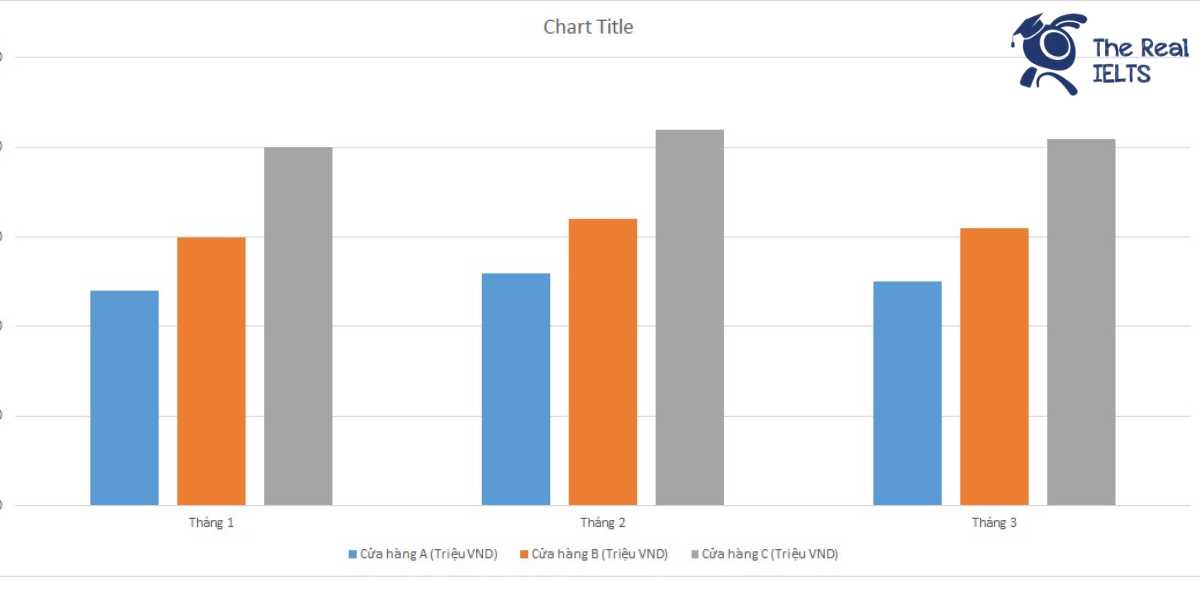
| Tháng | Cửa hàng A (Triệu VND) | Cửa hàng B (Triệu VND) | Cửa hàng C (Triệu VND) |
| Tháng 1 | 120 | 150 | 200 |
| Tháng 2 | 130 | 160 | 210 |
| Tháng 3 | 125 | 155 | 205 |

Bài mẫu 1
Introduction:
The table presents the revenue figures of three stores, A, B, and C, over three months: January, February, and March. The units are measured in millions of VND.
Overview:
Overall, Store C consistently generated the highest revenue across all three months, followed by Store B and then Store A. While there were some fluctuations in the monthly revenue of each store, the general trend indicates a slight increase in earnings for all stores from January to February, with a slight decline or stabilization from February to March.
Body 1:
In January, Store A recorded the lowest revenue at 120 million VND, while Store B and Store C earned 150 million VND and 200 million VND, respectively. In February, all three stores experienced an increase in their revenue. Store A’s revenue rose to 130 million VND, Store B’s to 160 million VND, and Store C’s to 210 million VND, maintaining the same ranking order among the stores.
Body 2:
In March, there were slight decreases in the revenue for Stores A and C, with Store A earning 125 million VND and Store C earning 205 million VND. However, Store B’s revenue decreased slightly to 155 million VND, but it remained consistent with its performance from the previous months. Despite these minor fluctuations, Store C continued to lead in terms of revenue throughout the period, consistently outperforming Stores A and B.
Bài mẫu 2
Introduction
The table presents the revenue figures in million VND for three different stores (Store A, Store B, and Store C) over a period of three months (January, February, and March).
Overview
Overall, Store C consistently generated the highest revenue each month, while Store A had the lowest figures throughout the three-month period. Additionally, there was a general upward trend in the revenues for all three stores from January to February, followed by a slight decrease or stagnation in March.
Body 1
In January, Store A earned 120 million VND, which was the lowest revenue compared to Store B’s 150 million VND and Store C’s 200 million VND. In February, Store A’s revenue increased to 130 million VND, Store B’s to 160 million VND, and Store C’s to 210 million VND. This shows a growth pattern for all stores, with Store C leading the way.
Body 2
In March, Store A experienced a slight decline in revenue to 125 million VND, whereas Store B saw a marginal decrease to 155 million VND. Store C’s revenue also dropped to 205 million VND. Despite these reductions, Store C maintained its position as the top revenue generator, followed by Store B and then Store A.
In summary, while all three stores showed positive revenue trends from January to February, there was a slight downturn in March, with Store C consistently outperforming the others.
Bài mẫu 3
Introduction
The table provides a statistical breakdown of the revenue generated by three different stores (Store A, Store B, and Store C) over a period of three months (January, February, and March), with the figures measured in millions of Vietnamese Dong (VND).
Overview
Overall, Store C consistently earned the highest revenue across all three months, followed by Store B, with Store A having the lowest earnings each month. All three stores showed fluctuations in their revenue over the given period, but the general trend for each store was relatively stable.
Body 1
In January, Store C led the revenue chart with 200 million VND, while Store B and Store A earned 150 million VND and 120 million VND respectively. In February, each store saw an increase in revenue: Store C’s revenue rose to 210 million VND, Store B’s to 160 million VND, and Store A’s to 130 million VND, maintaining the same ranking among the stores.
Body 2
In March, all three stores experienced a slight decrease in revenue compared to February. Store C’s earnings dropped to 205 million VND, Store B’s to 155 million VND, and Store A’s to 125 million VND. Despite these declines, Store C remained the top earner, followed by Store B, with Store A continuing to have the lowest revenue among the three.
In conclusion, Store C consistently generated the highest revenue over the three-month period, while Store A consistently had the lowest, with Store B’s revenue positioned in between the two.