IELTS Writing Task 1 yêu cầu thí sinh mô tả biểu đồ bar chart về số lượng người tham gia tập luyện thể thao trong 3 ngày tại ba thành phố khác nhau. Thí sinh cần phân tích sự thay đổi số lượng người tham gia theo thời gian, so sánh sự khác biệt giữa các thành phố và nhận xét xu hướng chung.
Đọc bài này Cách làm bài IELTS Writing Task 1 Bar Chart trước khi làm bài.
Bạn cũng có thể đọc lại bài nói về Task 1 tại đây: IELTS Writing Task 1 cần lưu ý những gì?
Đọc thêm về xây dựng lộ trình học IELTS của The Real IELTS.
IELTS Writing Task 1 Bar Chart: Sports Activities
You should spent about 20 mintutes on this task
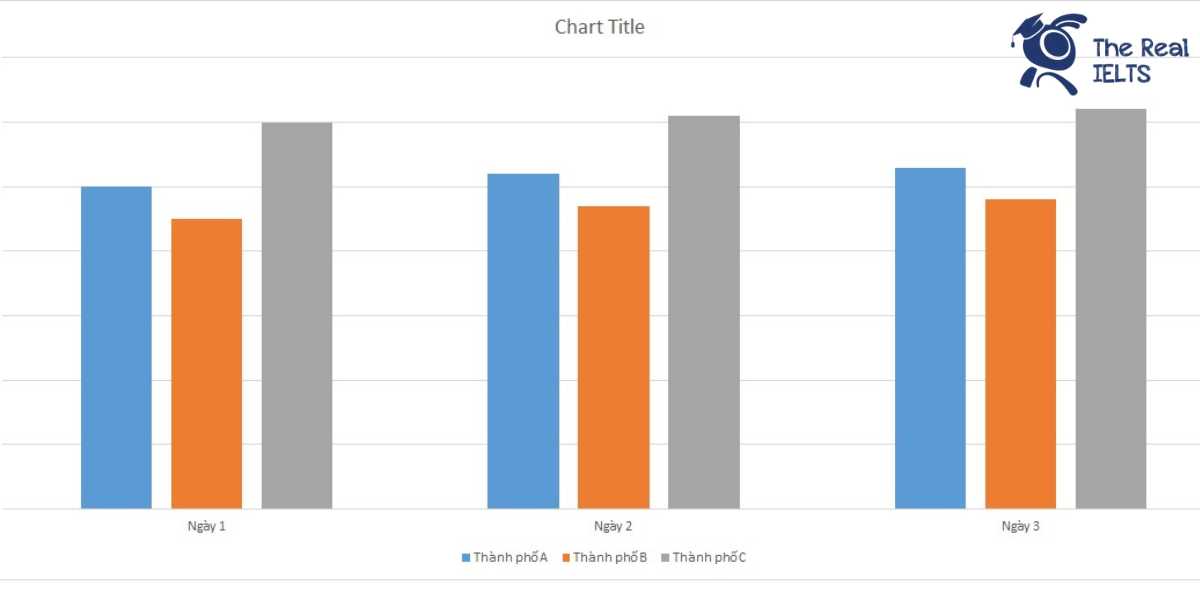
IELTS Writing Task 1 requires candidates to describe a bar chart showing the number of people participating in sports activities over three days in three different cities. Candidates need to analyze the changes in the number of participants over time, compare the differences between the cities, and comment on the overall trend.
You should write at least 150 words
| Thành phố | Ngày 1 | Ngày 2 | Ngày 3 |
| Thành phố A | 500 | 520 | 530 |
| Thành phố B | 450 | 470 | 480 |
| Thành phố C | 600 | 610 | 620 |

Bài mẫu 1
Introduction
The table provides statistical data on the number of people participating in sports activities over three days in three different cities: City A, City B, and City C.
Overview
Overall, it is evident that the number of participants in sports activities increases consistently each day across all three cities. City C consistently has the highest number of participants, while City B has the lowest.
Body 1
On the first day, City C leads with 600 participants, followed by City A with 500, and City B with 450. This trend continues on the second day, with City C increasing to 610 participants, City A to 520, and City B to 470.
Body 2
By the third day, the upward trend persists, with City C reaching 620 participants, City A at 530, and City B at 480. The data indicates a steady rise in the number of people engaging in sports activities over the three-day period in all cities, with City C showing the highest level of engagement throughout.
Bài mẫu 2
Introduction:
The table provided illustrates the number of people participating in sports activities over three days in three different cities: City A, City B, and City C.
Overview:
Overall, it is evident that the number of participants in all three cities showed a consistent increase over the three-day period. Among the cities, City C had the highest number of participants each day, whereas City B had the lowest.
Body 1:
In City A, the number of participants started at 500 on the first day. This number gradually increased to 520 on the second day and reached 530 on the third day. Similarly, City B saw a steady rise in the number of people engaging in sports, starting from 450 on the first day, moving up to 470 on the second day, and reaching 480 by the third day.
Body 2:
City C, which had the highest participation rates, began with 600 participants on the first day. This number increased slightly to 610 on the second day and continued to rise to 620 on the third day. The consistent upward trend in all three cities suggests a growing interest in sports activities over the observed period.
In conclusion, while all three cities experienced an increase in the number of sports participants over the three days, City C consistently had the highest number of participants, followed by City A and then City B.