IELTS Writing Task 1 yêu cầu bạn mô tả biểu đồ cột về chi phí vận chuyển hàng hóa trong ba tháng của ba công ty khác nhau. Bạn cần phân tích và so sánh dữ liệu để đưa ra nhận xét về xu hướng và sự khác biệt giữa các công ty. Biểu đồ cột cung cấp cái nhìn trực quan về sự biến đổi chi phí theo thời gian, giúp bạn dễ dàng xác định các công ty có chi phí cao hoặc thấp nhất trong từng tháng.
Đọc bài này Cách làm bài IELTS Writing Task 1 Bar Chart trước khi làm bài.
Bạn cũng có thể đọc lại bài nói về Task 1 tại đây: IELTS Writing Task 1 cần lưu ý những gì?
Đọc thêm về xây dựng lộ trình học IELTS của The Real IELTS.
IELTS Writing Task 1 Bar Chart: Transportation Costs
You should spent about 20 mintutes on this task
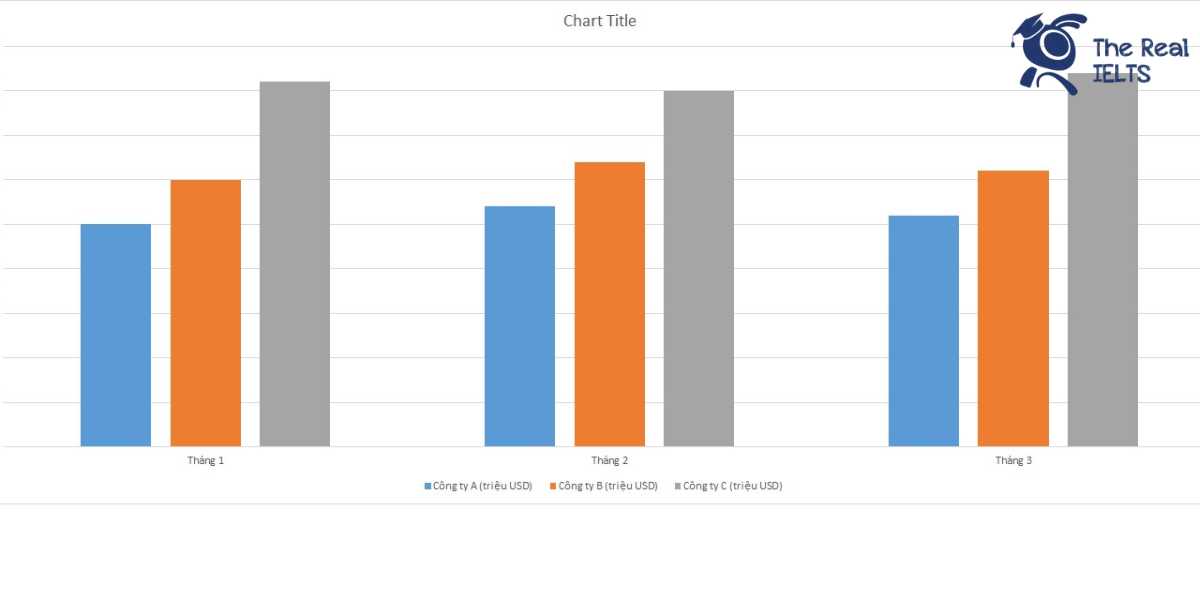
IELTS Writing Task 1 requires you to describe a bar chart depicting the transportation costs of goods over three months for three different companies. You need to analyze and compare the data to make observations about trends and differences between the companies. The bar chart provides a visual representation of cost variations over time, helping you easily identify which companies had the highest or lowest costs each month.
You should write at least 150 words.
| Tháng | Công ty A (triệu USD) | Công ty B (triệu USD) | Công ty C (triệu USD) |
| Tháng 1 | 2.5 | 3.0 | 4.1 |
| Tháng 2 | 2.7 | 3.2 | 4.0 |
| Tháng 3 | 2.6 | 3.1 | 4.2 |

IELTS Writing 1
Overview
This report analyzes the transportation costs incurred by three different companies—Company A, Company B, and Company C—over the first three months of the year. The data provides insights into the financial performance and cost management of each company, highlighting trends and variations in their expenditures.
Body 1: Company A
Company A’s transportation costs show a relatively stable pattern over the three months. In January, the company spent 2.5 million USD. This amount increased slightly to 2.7 million USD in February before decreasing to 2.6 million USD in March. The minor fluctuations suggest that Company A maintained consistent cost control strategies, with only a slight peak in February, possibly due to increased demand or operational adjustments.
Body 2: Company B and Company C
Company B also demonstrated a stable expenditure pattern, albeit at a slightly higher cost than Company A. January’s transportation costs were 3.0 million USD, rising to 3.2 million USD in February, and then slightly decreasing to 3.1 million USD in March. This indicates a small increase in transportation needs or cost adjustments during the middle month.
In contrast, Company C had the highest transportation costs among the three. January’s expenses were 4.1 million USD, decreasing marginally to 4.0 million USD in February, and then rising to 4.2 million USD in March. This fluctuation suggests more significant operational changes or varying transportation demands affecting their costs. The consistent increase in March could indicate a growth in business activities requiring more extensive logistics services.
IELTS Writing 2
Overview
This report analyzes the transportation costs of three companies—Company A, Company B, and Company C—over a three-month period. The data, presented in millions of USD, reveals variations in expenses for January, February, and March. By examining these costs, we can identify trends and differences in each company’s logistics expenditures.
Body 1
Company A
Company A’s transportation costs showed slight fluctuations over the three months. In January, the costs were 2.5 million USD. This amount increased to 2.7 million USD in February, marking a 0.2 million USD rise. However, in March, the costs decreased slightly to 2.6 million USD. Overall, Company A’s expenses remained relatively stable, with minor month-to-month variations.
Company B
Company B experienced a consistent increase in transportation costs from January to February, starting at 3.0 million USD and rising to 3.2 million USD. This trend did not continue into March, as expenses slightly decreased to 3.1 million USD. The changes in costs for Company B suggest a steady yet small increase followed by a minor reduction.
Body 2
Company C
Company C incurred the highest transportation costs among the three companies. In January, the expenses were 4.1 million USD. February saw a marginal decrease to 4.0 million USD. However, in March, the costs rose again to 4.2 million USD. This pattern indicates a fluctuating but generally high level of expenditure for Company C compared to Companies A and B.
Comparison
When comparing the three companies, Company C consistently had the highest transportation costs each month, followed by Company B and then Company A. While Company A’s expenses remained the most stable, Company B and Company C showed more noticeable fluctuations. This data suggests that Company C may face greater challenges in managing logistics expenses efficiently compared to the other two companies.
In conclusion, analyzing the transportation costs of these companies over the three months highlights distinct trends and variations. Company A maintains stable costs, Company B shows a slight increase followed by a small decrease, and Company C experiences the highest and most variable expenses.