IELTS Writing Task 1 yêu cầu thí sinh miêu tả tỷ lệ thất nghiệp từ năm 2011 đến năm 2022 của bốn thành phố khác nhau, thể hiện qua biểu đồ cột (Bar Chart). Thí sinh cần phân tích xu hướng, so sánh dữ liệu giữa các thành phố và qua các năm, đồng thời sử dụng từ vựng và cấu trúc câu đa dạng để diễn đạt ý kiến một cách rõ ràng và chính xác.
Đọc bài này Cách làm bài IELTS Writing Task 1 Bar Chart trước khi làm bài.
Bạn cũng có thể đọc lại bài nói về Task 1 tại đây: IELTS Writing Task 1 cần lưu ý những gì?
IELTS Writing Task 1 Bar Chart: Unemployment Rates
You should spent about 20 mintutes on this task
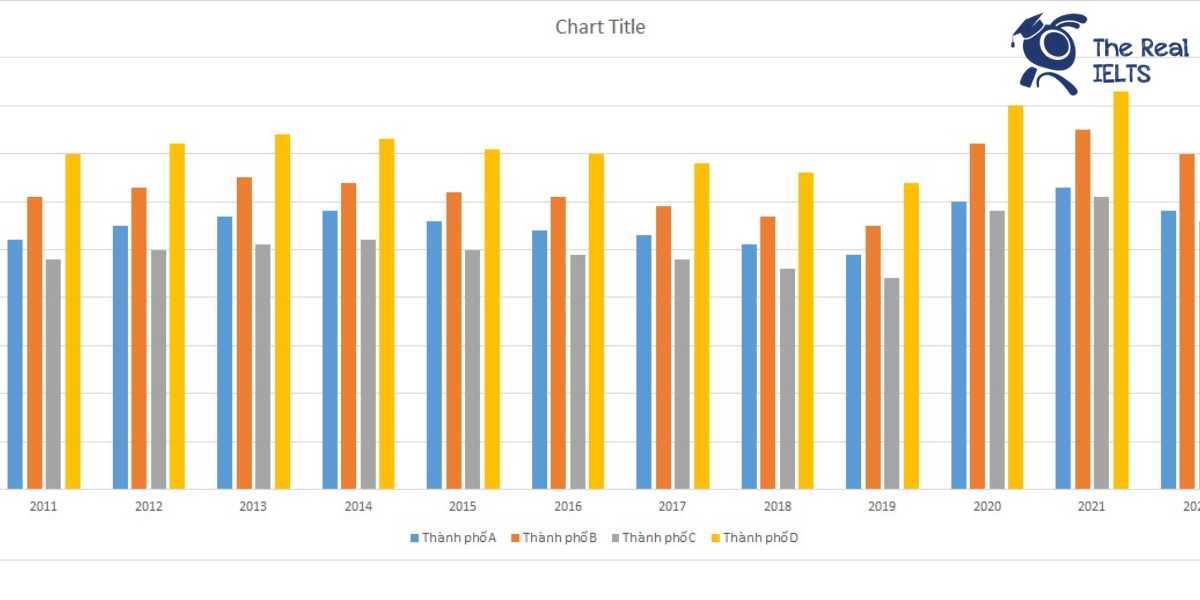
IELTS Writing Task 1 requires candidates to describe the unemployment rates from 2011 to 2022 for four different cities, as shown in a bar chart. Candidates need to analyze trends, compare data between cities and over the years, and use a variety of vocabulary and sentence structures to express their ideas clearly and accurately.
You should write at least 150 words.
| Năm | Thành phố A | Thành phố B | Thành phố C | Thành phố D |
| 2011 | 5.2% | 6.1% | 4.8% | 7.0% |
| 2012 | 5.5% | 6.3% | 5.0% | 7.2% |
| 2013 | 5.7% | 6.5% | 5.1% | 7.4% |
| 2014 | 5.8% | 6.4% | 5.2% | 7.3% |
| 2015 | 5.6% | 6.2% | 5.0% | 7.1% |
| 2016 | 5.4% | 6.1% | 4.9% | 7.0% |
| 2017 | 5.3% | 5.9% | 4.8% | 6.8% |
| 2018 | 5.1% | 5.7% | 4.6% | 6.6% |
| 2019 | 4.9% | 5.5% | 4.4% | 6.4% |
| 2020 | 6.0% | 7.2% | 5.8% | 8.0% |
| 2021 | 6.3% | 7.5% | 6.1% | 8.3% |
| 2022 | 5.8% | 7.0% | 5.6% | 7.8% |

Bài mẫu 1
Introduction
The table illustrates the unemployment rates in four hypothetical cities, namely City A, City B, City C, and City D, from 2011 to 2022.
Overview
Overall, City D consistently had the highest unemployment rate throughout the period, while City C maintained the lowest rates until 2020. Notably, all cities experienced a spike in unemployment rates in 2020, followed by a gradual recovery by 2022.
Body 1
In the initial years, City A saw a steady increase in its unemployment rate from 5.2% in 2011 to 5.8% in 2014. However, from 2015 onwards, the rate showed a fluctuating trend, decreasing to 5.1% by 2018 and reaching its lowest at 4.9% in 2019 before peaking at 6.3% in 2021 and then slightly decreasing to 5.8% in 2022.
City B followed a similar pattern with an increase from 6.1% in 2011 to 6.5% in 2013, then a gradual decline to 5.5% in 2019. However, it experienced the highest rise among the four cities, peaking at 7.5% in 2021, and ending at 7.0% in 2022.
Body 2
City C had the lowest unemployment rates at the beginning, starting from 4.8% in 2011 and maintaining rates below 5% until 2019. The rate then significantly increased to 6.1% in 2021 but improved to 5.6% by 2022.
City D consistently had the highest unemployment rates, beginning at 7.0% in 2011 and slightly increasing each year to reach 7.4% in 2013. This trend continued with some fluctuations until a sharp rise to 8.3% in 2021, followed by a reduction to 7.8% in 2022.
In conclusion, while all cities experienced fluctuations in their unemployment rates over the years, the most notable changes occurred around 2020, with a significant increase likely due to external factors, and a gradual recovery observed in the following years.
Bài mẫu 2
The table illustrates the unemployment rates in four hypothetical cities, namely City A, City B, City C, and City D, from 2011 to 2022.
Overall, all four cities experienced fluctuations in their unemployment rates throughout the given period, with noticeable increases around 2020 and subsequent declines towards 2022. City D consistently had the highest unemployment rates, while City C generally had the lowest.
In the first half of the period, City A saw a gradual increase in unemployment, peaking at 5.8% in 2014 before gradually decreasing to 4.9% in 2019. City B’s unemployment rate remained relatively stable between 6.1% and 6.5% from 2011 to 2014, then steadily declined to 5.5% by 2019. City C maintained the lowest rates, with only minor fluctuations between 4.4% and 5.2%, while City D showed a slow decline from 7.0% to 6.4% over the same period.
However, in 2020, all four cities saw a sharp increase in unemployment rates, likely due to external economic factors. City A’s rate spiked to 6.0%, City B’s to 7.2%, City C’s to 5.8%, and City D’s to 8.0%. By 2022, these rates had decreased, with City A at 5.8%, City B at 7.0%, City C at 5.6%, and City D at 7.8%, showing a partial recovery but still higher than pre-2020 levels.
In summary, while there were periods of both increase and decrease in unemployment rates across all four cities, the rates surged in 2020, followed by a gradual decline towards 2022, reflecting a trend influenced by broader economic conditions.