IELTS Writing Task 1 yêu cầu mô tả biểu đồ Bar Chart về lượng tiêu thụ nước của ba hộ gia đình trong ba ngày. Biểu đồ minh họa mức độ sử dụng nước hàng ngày, so sánh giữa các hộ gia đình. Bài viết cần phân tích dữ liệu, nêu rõ xu hướng, sự khác biệt và đưa ra những nhận xét tổng quan.
Đọc bài này Cách làm bài IELTS Writing Task 1 Bar Chart trước khi làm bài.
Bạn cũng có thể đọc lại bài nói về Task 1 tại đây: IELTS Writing Task 1 cần lưu ý những gì?
Đọc thêm về xây dựng lộ trình học IELTS của The Real IELTS.
IELTS Writing Task 1 Bar Chart: Water Consumption
You should spent about 20 mintutes on this task
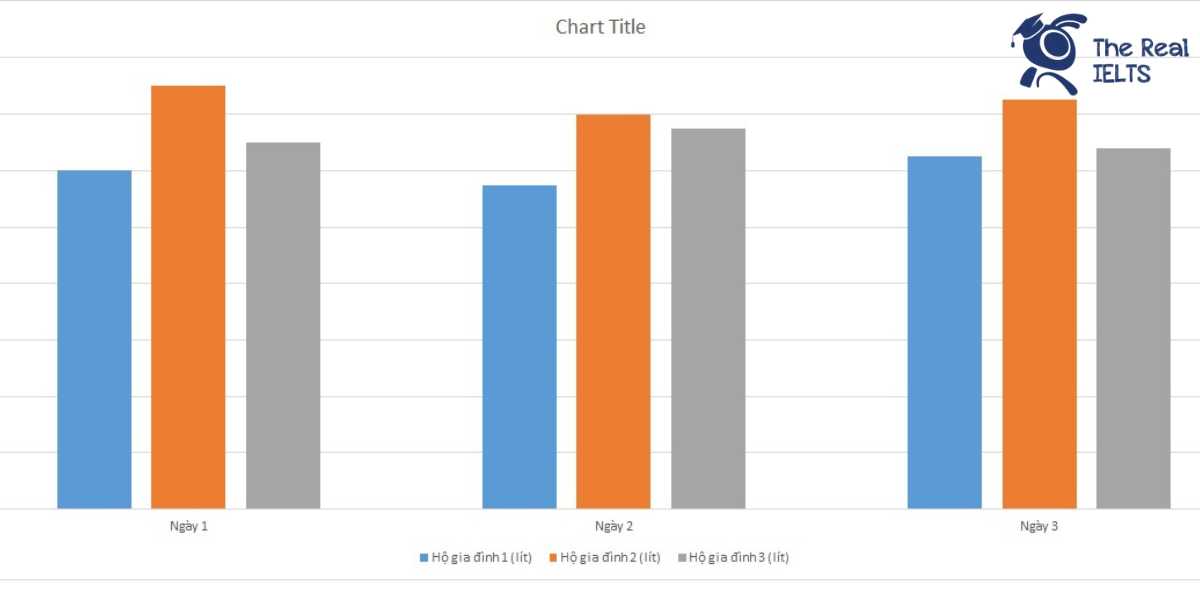
IELTS Writing Task 1 requires describing a Bar Chart illustrating the water consumption of three households over three days. The chart depicts the daily water usage levels, comparing between the households. The essay needs to analyze the data, highlight trends, differences, and provide an overall assessment.
You should write at least 150 words
| Ngày | Hộ gia đình 1 (lít) | Hộ gia đình 2 (lít) | Hộ gia đình 3 (lít) |
| Ngày 1 | 120 | 150 | 130 |
| Ngày 2 | 115 | 140 | 135 |
| Ngày 3 | 125 | 145 | 128 |

Bài mẫu 1
Introduction
The table illustrates the water consumption, measured in liters, of three households over a three-day period.
Overview
Overall, Household 2 consistently consumed the most water each day, while Household 1 and Household 3 had more fluctuations in their daily water usage. Additionally, Household 1 had the lowest water consumption on two out of the three days.
Body 1
On Day 1, Household 2 consumed the highest amount of water at 150 liters, followed by Household 3 with 130 liters, and Household 1 with 120 liters. On Day 2, Household 2 maintained the highest consumption at 140 liters, though it decreased by 10 liters from the previous day. Household 3 increased its usage slightly to 135 liters, whereas Household 1 reduced its consumption to 115 liters, the lowest for that day.
Body 2
On the final day, Household 2’s water consumption increased slightly to 145 liters, continuing to lead among the three households. Household 1’s usage rose to 125 liters, surpassing Household 3, which saw a decrease to 128 liters. Throughout the three-day period, Household 2 remained the highest water consumer, while Household 1 had the most significant fluctuations in daily water usage.
Bài mẫu 2
Introduction
The table provides a statistical overview of water consumption by three households over a three-day period.
Overview
Overall, the data indicate that water usage fluctuated slightly across the three days, with each household showing some variation in their daily consumption. Household 2 consistently recorded the highest water usage, while Household 1 and Household 3 displayed more variability in their daily totals.
Body 1
On the first day, Household 1 consumed 120 liters of water, Household 2 used 150 liters, and Household 3 recorded 130 liters. This trend continued on the second day, although there was a slight decrease in usage for all households. Specifically, Household 1’s consumption dropped to 115 liters, Household 2 used 140 liters, and Household 3 increased their usage slightly to 135 liters.
Body 2
On the third day, there was an increase in water consumption for Household 1, rising to 125 liters, while Household 2 and Household 3 showed varied changes in their usage. Household 2’s consumption rose slightly to 145 liters, whereas Household 3’s usage decreased to 128 liters. Despite these fluctuations, Household 2 maintained the highest overall water consumption across the three days.
Overall, the table illustrates that while water consumption patterns varied day by day, Household 2 consistently had the highest water usage among the three households.
Bài mẫu 3
Introduction
The table illustrates the water consumption in liters over three days for three different households.
Overview
Overall, Household 2 consistently consumed the most water each day, while Household 1 and Household 3 had slightly lower and more fluctuating consumption rates.
Body 1
On Day 1, Household 1 used 120 liters, Household 2 consumed 150 liters, and Household 3 used 130 liters. The following day saw a slight decrease in consumption for all three households, with Household 1 using 115 liters, Household 2 consuming 140 liters, and Household 3 increasing slightly to 135 liters.
Body 2
By Day 3, Household 1’s water consumption increased again to 125 liters. Household 2’s consumption slightly rose to 145 liters, while Household 3 experienced a decline in usage, dropping to 128 liters. Despite the fluctuations, Household 2 consistently had the highest water consumption throughout the observed period.