IELTS Writing Task 1 yêu cầu thí sinh mô tả một biểu đồ Bar Chart về số lượng vụ tai nạn lao động trong ba tháng tại ba quốc gia khác nhau. Nhiệm vụ của thí sinh là phân tích và so sánh số liệu, làm nổi bật các xu hướng chính và sự khác biệt giữa các quốc gia. Kỹ năng miêu tả và khả năng sử dụng ngôn ngữ chính xác là yếu tố quan trọng để đạt điểm cao.
Đọc bài này Cách làm bài IELTS Writing Task 1 Bar Chart trước khi làm bài.
Bạn cũng có thể đọc lại bài nói về Task 1 tại đây: IELTS Writing Task 1 cần lưu ý những gì?
Đọc thêm về xây dựng lộ trình học IELTS của The Real IELTS.
IELTS Writing Task 1 Bar Chart: Workplace Accidents
You should spent about 20 mintutes on this task
IELTS Writing Task 1 requires candidates to describe a Bar Chart showing the number of workplace accidents over three months in three different countries. Candidates are tasked with analyzing and comparing the data, highlighting key trends and differences between the countries. Descriptive skills and the ability to use accurate language are crucial factors for achieving a high score.
You should write at least 150 words.
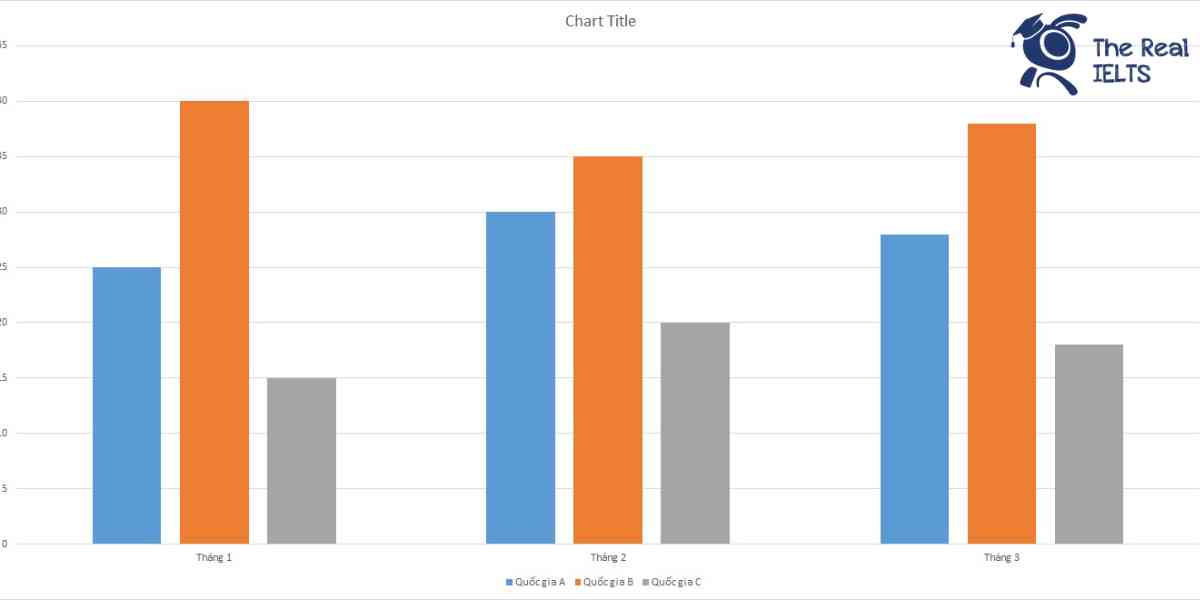
| Tháng | Quốc gia A | Quốc gia B | Quốc gia C |
| Tháng 1 | 25 | 40 | 15 |
| Tháng 2 | 30 | 35 | 20 |
| Tháng 3 | 28 | 38 | 18 |

Bài mẫu 1
Overview
This report provides a statistical analysis of workplace accidents in three different countries—Country A, Country B, and Country C—over a period of three months. The data reflects hypothetical figures for January, February, and March. This analysis aims to identify trends and patterns in the occurrence of workplace accidents within this timeframe.
Body 1: Country-by-Country Analysis
In January, Country A reported 25 workplace accidents, Country B had the highest with 40, and Country C recorded 15. In February, the number of accidents in Country A increased to 30, while Country B saw a slight decrease to 35. Country C’s accidents rose to 20. March saw Country A’s accidents slightly decrease to 28, whereas Country B’s accidents increased again to 38, and Country C experienced a minor decrease to 18. Country B consistently recorded the highest number of accidents each month, while Country C had the lowest figures.
Body 2: Trends and Patterns
Analyzing the trends over the three months, it is evident that Country A experienced a fluctuating trend with an initial increase in February followed by a slight decrease in March. Country B’s figures also fluctuated, with a decrease in February and an increase in March. Country C, on the other hand, showed a gradual increase from January to February, followed by a decrease in March. Overall, the data suggests that workplace safety conditions varied across these countries, with Country B consistently facing higher accident rates. These insights could help in formulating targeted safety measures and policies to reduce workplace accidents in the future.
Bài mẫu 2
Overview
The provided data outlines the number of workplace accidents recorded over three months—January, February, and March—in three different countries, labeled as Country A, Country B, and Country C. This data allows for a comparative analysis of the frequency of workplace accidents within these countries and helps identify trends over the specified period.
Body 1
In January, Country B experienced the highest number of workplace accidents, with 40 incidents, significantly higher than the 25 incidents in Country A and 15 in Country C. This indicates that at the start of the year, Country B faced considerable challenges in maintaining workplace safety compared to the other two countries. The disparity suggests potential issues in safety regulations or enforcement in Country B during this month.
Body 2
February saw a shift in the trends, with the number of accidents increasing in Countries A and C. Country A reported 30 incidents, a rise from January, while Country C reported 20, showing an upward trend as well. Conversely, Country B saw a slight decrease in accidents, down to 35. This change suggests that while Countries A and C struggled with rising incidents, Country B might have implemented some effective measures to reduce workplace accidents.
By March, the number of accidents in all three countries converged somewhat, with Country A reporting 28 incidents, Country B 38, and Country C 18. Although Country B still had the highest number of accidents, the overall gap between the countries decreased, indicating a possible improvement in workplace safety practices across the board.
Overall, while Country B consistently had the highest number of accidents, the trends suggest that all three countries faced challenges in maintaining consistent workplace safety, with varying levels of success in mitigating these issues over the three-month period.