IELTS Writing Task 1 yêu cầu thí sinh mô tả biểu đồ Bar Chart về tỷ lệ sử dụng dịch vụ ngân hàng điện tử trong 3 ngày của 3 ngân hàng khác nhau. Biểu đồ này so sánh mức độ sử dụng các dịch vụ ngân hàng trực tuyến tại Ngân hàng A, B, và C, qua ba ngày cụ thể. Thí sinh cần phân tích và trình bày sự khác biệt, xu hướng tăng giảm và so sánh tỷ lệ giữa các ngân hàng.
Đọc bài này Cách làm bài IELTS Writing Task 1 Bar Chart trước khi làm bài.
Bạn cũng có thể đọc lại bài nói về Task 1 tại đây: IELTS Writing Task 1 cần lưu ý những gì?
Đọc thêm về xây dựng lộ trình học IELTS của The Real IELTS.
IELTS Writing Task 1 Bar Chart: Electronic Banking
You should spent about 20 mintutes on this task
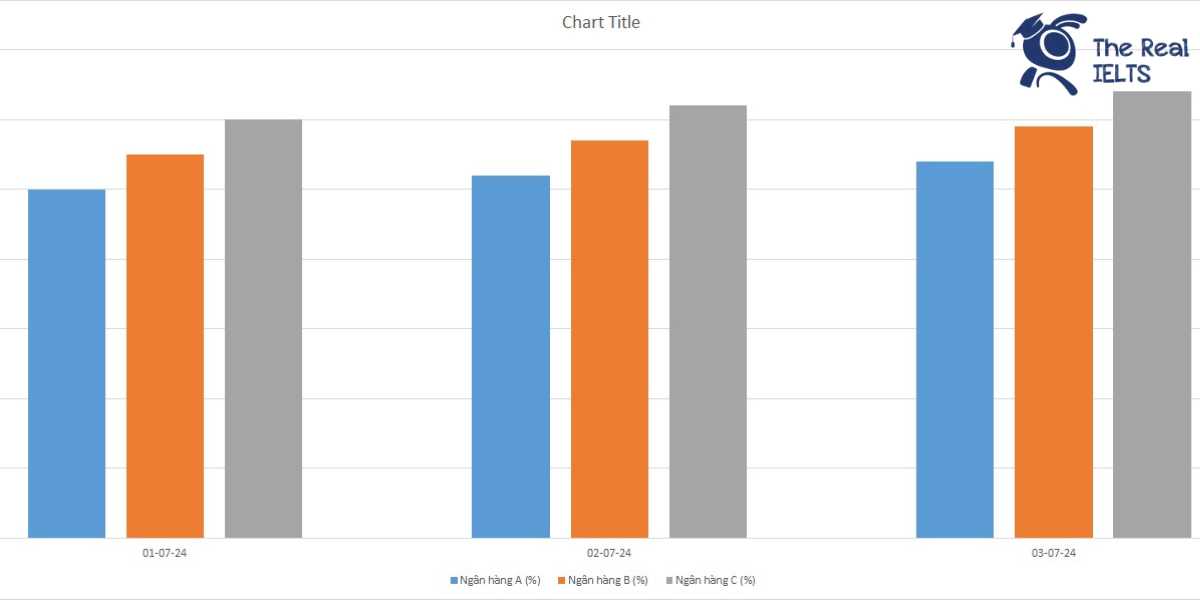
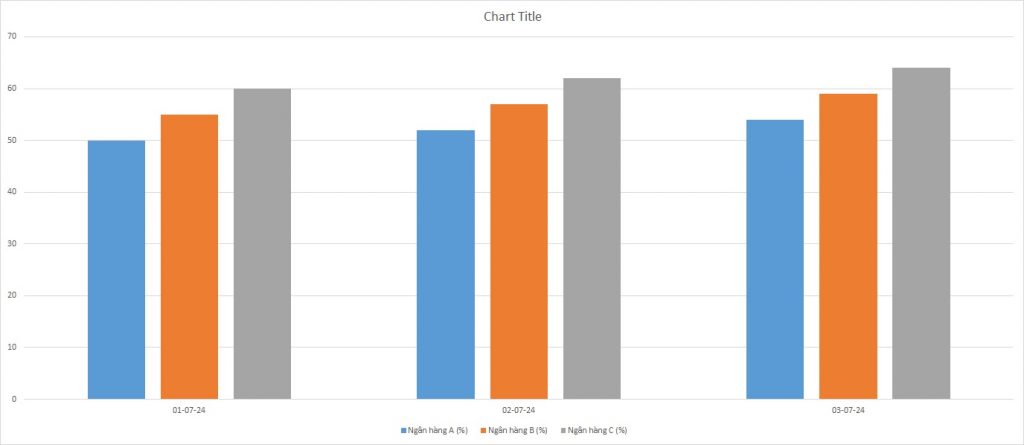
IELTS Writing Task 1 requires candidates to describe a Bar Chart illustrating the usage rates of electronic banking services over 3 days for 3 different banks. This chart compares the usage levels of online banking services at Bank A, Bank B, and Bank C over specific days. Candidates need to analyze and present the differences, trends, and compare the rates between the banks.
You should write at least 150 words.
| Ngày | Ngân hàng A (%) | Ngân hàng B (%) | Ngân hàng C (%) |
| 01-07-24 | 50 | 55 | 60 |
| 02-07-24 | 52 | 57 | 62 |
| 03-07-24 | 54 | 59 | 64 |
Bài mẫu 1
Overview
The usage of electronic banking services has seen significant growth in recent years. This trend is evident across various banks as more customers opt for the convenience and efficiency of online banking. In this hypothetical analysis, we will examine the daily usage percentages of three banks over a period of three days. The banks in question are Bank A, Bank B, and Bank C.
Body 1
Starting with Bank A, the data shows a fluctuation in the usage of electronic banking services over the three-day period. On Day 1, the usage was 25%. This figure increased to 30% on Day 2, indicating a growing adoption among customers. However, on Day 3, the usage slightly decreased to 28%. This small decline might suggest a temporary dip or possibly the impact of external factors such as technical issues or user experience challenges. Nonetheless, the overall trend for Bank A remains positive with a clear upward trajectory from Day 1 to Day 3.
Body 2
Bank B and Bank C also exhibit interesting patterns in their electronic banking service usage. For Bank B, the usage started at 20% on Day 1 and showed a gradual increase to 22% on Day 2 and 25% on Day 3. This steady rise reflects a consistent increase in user engagement and trust in the bank’s electronic services. Similarly, Bank C saw usage grow from 18% on Day 1 to 20% on Day 2 and then to 23% on Day 3. Although the initial usage was lower compared to Bank A and Bank B, the upward trend in Bank C’s data suggests a growing customer base for their electronic banking services. This consistent increase across all three banks highlights a broader trend towards the adoption of digital banking solutions.
Bài mẫu 2
Overview
The usage of electronic banking services is a key indicator of a bank’s technological adoption and customer engagement. This essay will analyze the hypothetical data of three banks over three days to understand trends and patterns. The banks in question are Bank A, Bank B, and Bank C, and their usage percentages over three days provide insights into customer behavior and preferences.
Body 1
Bank A
Bank A shows a notable fluctuation in its electronic banking service usage. On Day 1, the usage rate is 25%, which increases to 30% on Day 2. This rise indicates a significant uptick in customer engagement, potentially due to promotional activities or improved service features. However, by Day 3, the usage slightly drops to 28%. Despite this minor decrease, Bank A maintains the highest usage rates among the three banks, suggesting a robust and stable customer base that frequently utilizes electronic banking services.
Body 2
Bank B and Bank C
Bank B and Bank C exhibit more gradual increases in their electronic banking service usage. Bank B starts at 20% on Day 1, slightly rising to 22% on Day 2, and reaching 25% on Day 3. This steady growth reflects a consistent improvement in customer adoption of digital services. Bank C, on the other hand, has the lowest initial usage rate of 18% on Day 1. However, it shows a similar upward trend, increasing to 20% on Day 2 and 23% on Day 3. This consistent growth for both banks highlights a positive trend in customer engagement, although at a slower pace compared to Bank A.
In summary, the data suggests that while all three banks are experiencing growth in electronic banking service usage, Bank A leads with the highest and most fluctuating rates, whereas Bank B and Bank C show steady and gradual increases. This analysis helps in understanding customer preferences and the effectiveness of electronic banking services offered by these banks.