IELTS Writing Task 1 yêu cầu phân tích biểu đồ bar chart về tỷ lệ nợ xấu trong 3 tháng của ba ngân hàng. Người viết cần mô tả các xu hướng chính, so sánh tỷ lệ giữa các ngân hàng và các tháng, và nêu bật các điểm đáng chú ý, sử dụng số liệu cụ thể để minh họa.
Đọc bài này Cách làm bài IELTS Writing Task 1 Bar Chart trước khi làm bài.
Bạn cũng có thể đọc lại bài nói về Task 1 tại đây: IELTS Writing Task 1 cần lưu ý những gì?
Đọc thêm về xây dựng lộ trình học IELTS của The Real IELTS.
IELTS Writing Task 1 Bar Chart: Bad Debt
You should spent about 20 mintutes on this task
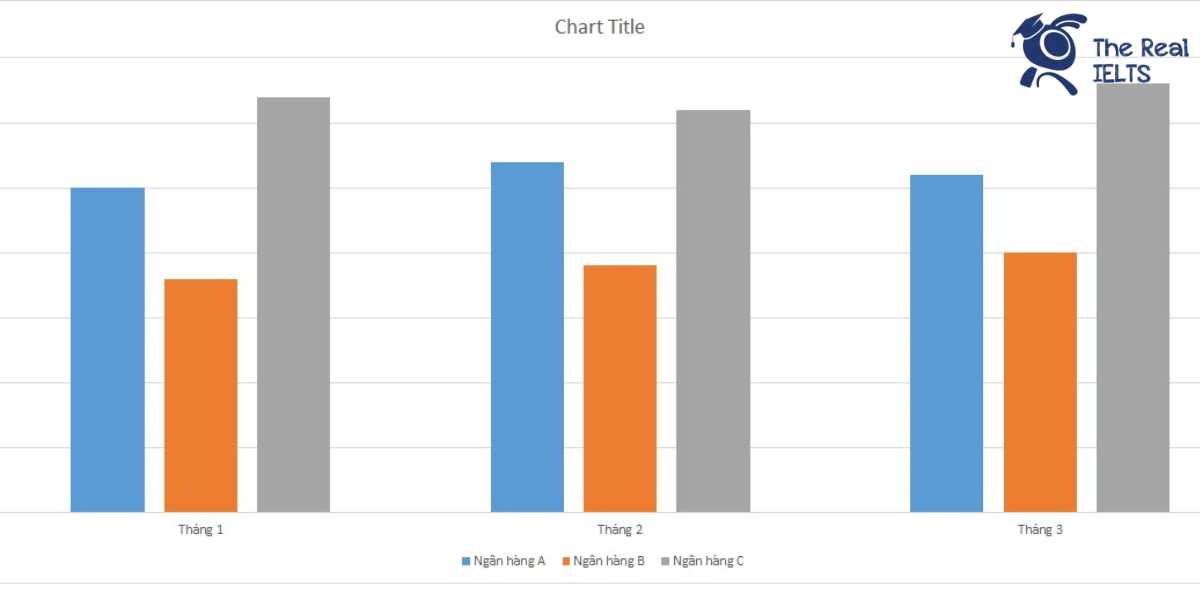
IELTS Writing Task 1 requires analyzing a bar chart depicting the bad debt ratios over three months for three banks. The writer needs to describe the main trends, compare the ratios between the banks and the months, and highlight notable points, using specific figures to illustrate.
You should write at least 150 words
| Ngân hàng | Tháng 1 | Tháng 2 | Tháng 3 |
| Ngân hàng A | 2.5% | 2.7% | 2.6% |
| Ngân hàng B | 1.8% | 1.9% | 2.0% |
| Ngân hàng C | 3.2% | 3.1% | 3.3% |

Bài mẫu 1
Introduction
The table illustrates the non-performing loan (NPL) ratios of three banks (Bank A, Bank B, and Bank C) over a three-month period.
Overview
Overall, Bank C consistently had the highest NPL ratios each month, whereas Bank B had the lowest. Bank A’s NPL ratios showed slight fluctuations but remained higher than Bank B’s and lower than Bank C’s.
Body 1
In January, Bank C had the highest NPL ratio at 3.2%, followed by Bank A at 2.5%, and Bank B at 1.8%. In February, Bank A and Bank B both experienced slight increases in their NPL ratios, with Bank A rising to 2.7% and Bank B to 1.9%. Meanwhile, Bank C’s ratio decreased marginally to 3.1%.
Body 2
In March, Bank C’s NPL ratio rose again to 3.3%, maintaining its position as the bank with the highest NPL ratio. Bank A saw a slight decrease in its NPL ratio to 2.6%, while Bank B experienced a further increase to 2.0%. This data indicates that while Bank B consistently had the lowest NPL ratios, it also showed a steady upward trend over the three months.
Bài mẫu 2
Introduction
The table presents data on the percentage of non-performing loans (NPLs) at three different banks over a three-month period.
Overview
Overall, Bank C consistently had the highest percentage of NPLs, while Bank B maintained the lowest percentages. All three banks experienced slight fluctuations in their NPL rates over the observed months.
Body 1
In January, Bank A reported an NPL rate of 2.5%, which increased marginally to 2.7% in February before slightly declining to 2.6% in March. Bank B had the lowest initial NPL rate at 1.8% in January, which gradually rose to 1.9% in February and further to 2.0% in March.
Body 2
Bank C had the highest NPL rates among the three banks throughout the period. Starting at 3.2% in January, it experienced a slight decrease to 3.1% in February before increasing again to 3.3% in March. Despite these fluctuations, Bank C’s NPL rates remained higher than those of Banks A and B in all three months.
In summary, while there were minor variations in the NPL percentages across the three banks, Bank C consistently had the highest rates, and Bank B had the lowest.