IELTS Writing Task 1 yêu cầu miêu tả biểu đồ Bar Chart về số lượng xe bán ra hàng tháng trong năm 2021 của 4 hãng xe. Người viết cần phân tích và so sánh dữ liệu giữa các tháng và hãng xe, nêu rõ xu hướng chính, điểm nổi bật và biến động, sử dụng từ vựng và cấu trúc ngữ pháp phù hợp.
Đọc bài này Cách làm bài IELTS Writing Task 1 Bar Chart trước khi làm bài.
Bạn cũng có thể đọc lại bài nói về Task 1 tại đây: IELTS Writing Task 1 cần lưu ý những gì?
IELTS Writing Task 1 Bar Chart: Car Sales
You should spent about 20 mintutes on this task
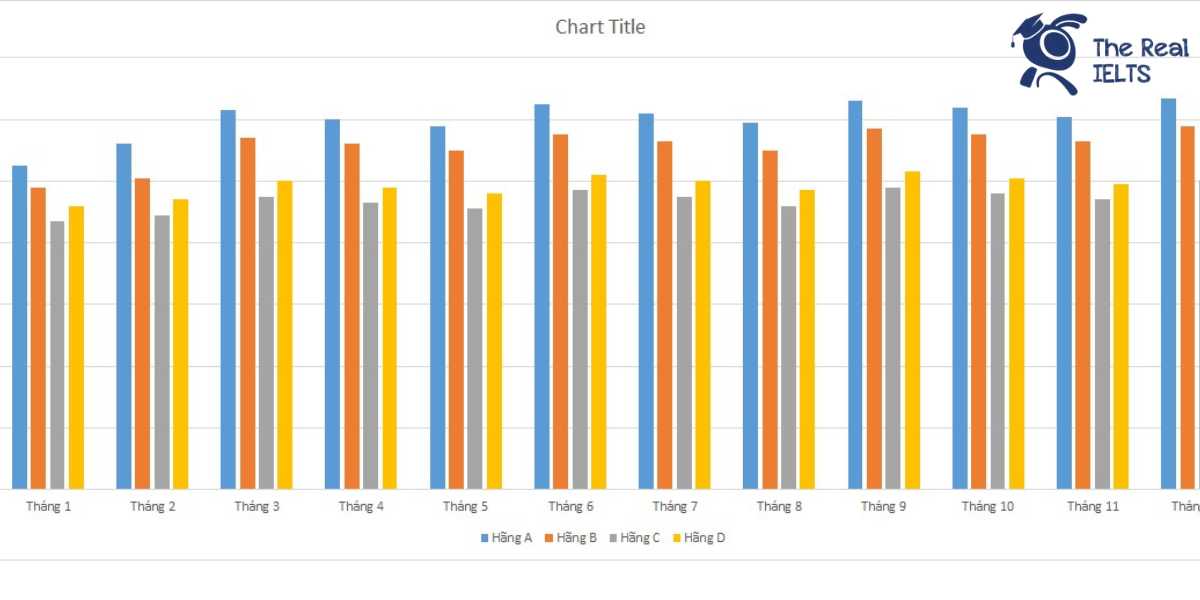
IELTS Writing Task 1 requires describing a Bar Chart illustrating the monthly car sales of four car manufacturers in 2021. The writer needs to analyze and compare the data between months and manufacturers, highlighting main trends, notable points, and fluctuations, using appropriate vocabulary and grammatical structures.
You should write at least 150 words.
| Tháng | Hãng A | Hãng B | Hãng C | Hãng D |
| Tháng 1 | 10,500 | 9,800 | 8,700 | 9,200 |
| Tháng 2 | 11,200 | 10,100 | 8,900 | 9,400 |
| Tháng 3 | 12,300 | 11,400 | 9,500 | 10,000 |
| Tháng 4 | 12,000 | 11,200 | 9,300 | 9,800 |
| Tháng 5 | 11,800 | 11,000 | 9,100 | 9,600 |
| Tháng 6 | 12,500 | 11,500 | 9,700 | 10,200 |
| Tháng 7 | 12,200 | 11,300 | 9,500 | 10,000 |
| Tháng 8 | 11,900 | 11,000 | 9,200 | 9,700 |
| Tháng 9 | 12,600 | 11,700 | 9,800 | 10,300 |
| Tháng 10 | 12,400 | 11,500 | 9,600 | 10,100 |
| Tháng 11 | 12,100 | 11,300 | 9,400 | 9,900 |
| Tháng 12 | 12,700 | 11,800 | 10,000 | 10,500 |

Bài mẫu
Introduction:
The table provides data on the monthly car sales of four car manufacturers (A, B, C, and D) throughout the year 2021.
Overview:
Overall, Company A consistently sold the highest number of cars each month, while Company C had the lowest sales. Sales for all companies showed some fluctuations but remained relatively stable over the year.
Body 1:
Company A experienced a general upward trend in sales, starting at 10,500 in January and peaking at 12,700 in December. The most significant increase was observed between February (11,200) and March (12,300). Similarly, Company B’s sales showed an overall increasing trend, beginning with 9,800 in January and reaching 11,800 in December. The largest rise occurred from February (10,100) to March (11,400).
Body 2:
Company C had the lowest sales among the four companies, ranging from 8,700 in January to 10,000 in December. Although there were slight increases and decreases, the sales numbers remained quite steady throughout the year. In contrast, Company D had sales figures varying between 9,200 in January and 10,500 in December. Like Company C, Company D’s sales remained relatively stable with minor fluctuations.
Conclusion:
In summary, Company A led in car sales each month, followed by Company B, while Companies C and D had the lowest and more stable sales respectively.
Bài mẫu 2
Introduction
The table provides data on the monthly car sales of four different manufacturers (A, B, C, and D) over the year 2021.
Overview
Overall, Company A consistently sold the highest number of cars each month, while Company C had the lowest sales figures throughout the year. The sales figures for all companies fluctuated within a relatively narrow range.
Body 1
Company A’s sales began at 10,500 units in January, peaked at 12,700 units in December, and fluctuated between these values throughout the year. Company B followed a similar pattern, starting at 9,800 units in January and ending at 11,800 units in December, with the highest sales in September (11,700 units).
Body 2
Company C consistently recorded the lowest sales, starting at 8,700 units in January and experiencing only a slight increase, peaking at 10,000 units in December. Company D’s sales were more variable, starting at 9,200 units in January and closing at 10,500 units in December, with a peak in September at 10,300 units.
In summary, Company A consistently led in sales, followed by Company B, while Company C lagged behind. Company D’s sales were somewhat erratic but showed an overall upward trend towards the end of the year.