IELTS Writing Task 1 yêu cầu mô tả biểu đồ bar chart thể hiện số lượng trẻ em đến học tại ba trường ở ba thành phố khác nhau. Biểu đồ cung cấp dữ liệu so sánh giữa các trường trong các thành phố, từ đó giúp thí sinh phân tích và nhận xét về xu hướng, sự chênh lệch và những điểm nổi bật trong số lượng học sinh. Bài viết cần có cấu trúc rõ ràng, từ ngữ phong phú và chính xác để đạt điểm cao.
Đọc bài này Cách làm bài IELTS Writing Task 1 Bar Chart trước khi làm bài.
Bạn cũng có thể đọc lại bài nói về Task 1 tại đây: IELTS Writing Task 1 cần lưu ý những gì?
Đọc thêm về xây dựng lộ trình học IELTS của The Real IELTS.
IELTS Writing Task 1 Bar Chart: Children Attending
You should spent about 20 mintutes on this task
IELTS Writing Task 1 requires describing a bar chart depicting the number of children attending schools in three different cities. The chart provides data comparing schools across these cities, enabling candidates to analyze trends, differences, and notable points in student numbers. The essay should have a clear structure, rich and accurate language to achieve a high score.
You should write at least 150 words.
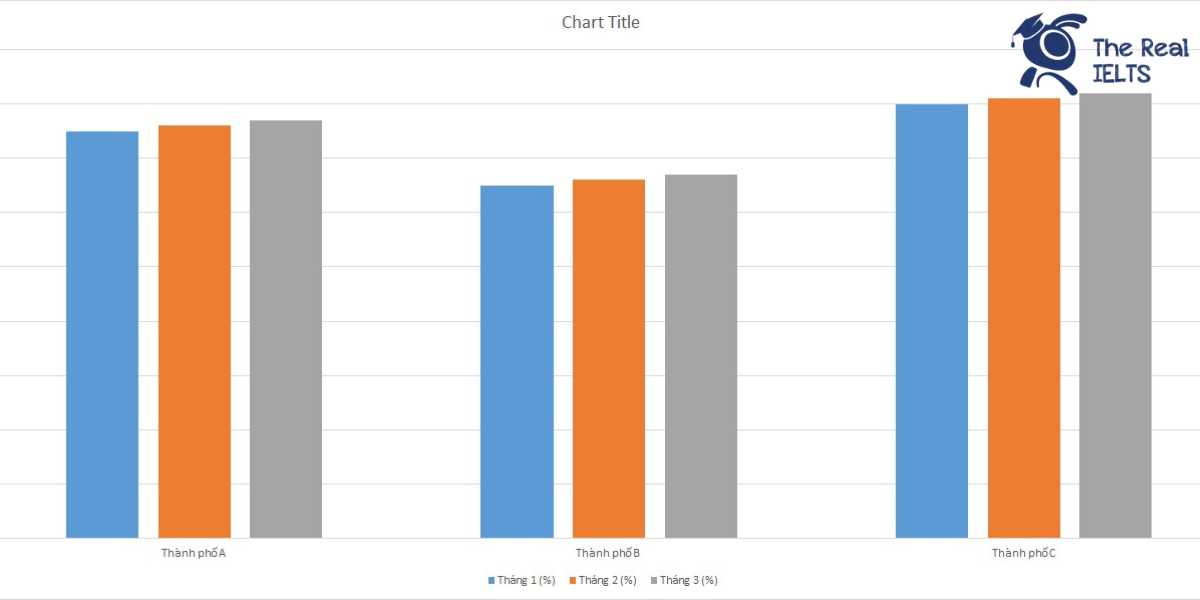
| Thành phố | Tháng 1 (%) | Tháng 2 (%) | Tháng 3 (%) |
| Thành phố A | 75 | 76 | 77 |
| Thành phố B | 65 | 66 | 67 |
| Thành phố C | 80 | 81 | 82 |

Bài mẫu 1
Overview
This report presents an analysis of the number of children attending three different schools—School A, School B, and School C—over the first three months of 2024. The data shows the monthly attendance figures for January, February, and March. This comparison will help in understanding the trends and fluctuations in the number of children attending each school during this period.
Body 1
In January 2024, the attendance figures were as follows: School A had 120 students, School B had 150 students, and School C had 130 students. School B had the highest attendance, while School A had the lowest. This month sets the baseline for our comparison, showing a significant difference in attendance numbers among the three schools.
In February 2024, there was a slight decrease in the number of students attending School A and School C, with figures dropping to 115 and 125 respectively. However, School B saw an increase in attendance, rising to 155 students. This suggests that School B might have implemented strategies to attract more students or retained its students more effectively than the other schools.
Body 2
By March 2024, the attendance figures changed again, with School A increasing its number to 125 students, School B reaching 160 students, and School C rising to 135 students. This month marked the highest attendance for all three schools during the three-month period. School B consistently maintained the highest attendance figures, suggesting it might have superior facilities or programs attracting more students.
Overall, the data reveals a clear trend of increasing attendance for all schools over the three months, with School B leading in attendance figures throughout. The consistent increase indicates possible improvements or positive developments within the schools, contributing to their ability to attract and retain students.
Bài mẫu 2
Overview
The following analysis presents a comparative study of the number of children attending three different schools—School A, School B, and School C—over a period of three months in early 2024. The data, collected in January, February, and March, provides insight into trends and variations in attendance across these institutions.
Body 1
In January 2024, the attendance figures were as follows: School A had 120 children, School B had 150 children, and School C had 130 children. Among the three schools, School B recorded the highest number of attendees, followed by School C, with School A having the fewest children. This month marked a strong start for School B in terms of attendance.
In February 2024, there was a slight decrease in the number of children attending School A, with the figure dropping to 115. On the other hand, School B saw an increase, with the number of children rising to 155. School C experienced a decrease as well, with attendance falling to 125 children. This month highlighted a growing disparity between the schools, particularly with School B continuing to attract more children.
Body 2
March 2024 saw a rebound in attendance for all three schools. School A increased its number of attendees to 125 children, surpassing its January figures. School B continued its upward trend, reaching 160 children, the highest among the three months and schools. School C also saw an increase, with 135 children attending. This month displayed a positive trend for all schools, with School B maintaining its position as the school with the highest attendance.
Overall, the data indicates that while there were fluctuations in the number of children attending each school, School B consistently had the highest attendance figures across all three months. This could be attributed to various factors such as reputation, resources, and programs offered. The increasing trend in March for all schools suggests a possible seasonal or programmatic influence boosting attendance.