IELTS Writing Task 1 yêu cầu mô tả lượng tiêu thụ cà phê trong ba ngày của ba cửa hàng cafe khác nhau qua biểu đồ Bar Chart. Bạn cần phân tích dữ liệu và so sánh mức tiêu thụ giữa các cửa hàng trong các ngày. Chú ý đến xu hướng, điểm cao/thấp và sự khác biệt đáng chú ý để đưa ra một bài viết rõ ràng, mạch lạc và đầy đủ thông tin.
Đọc bài này Cách làm bài IELTS Writing Task 1 Bar Chart trước khi làm bài.
Bạn cũng có thể đọc lại bài nói về Task 1 tại đây: IELTS Writing Task 1 cần lưu ý những gì?
Đọc thêm về xây dựng lộ trình học IELTS của The Real IELTS.
IELTS Writing Task 1 Bar Chart: Coffee Consumption
You should spent about 20 mintutes on this task
IELTS Writing Task 1 requires describing the coffee consumption over three days at three different cafes using a Bar Chart. You need to analyze the data and compare the consumption levels among the cafes over the days. Pay attention to trends, highs/lows, and notable differences to produce a clear, coherent, and comprehensive report.
You should write at least 150 words.
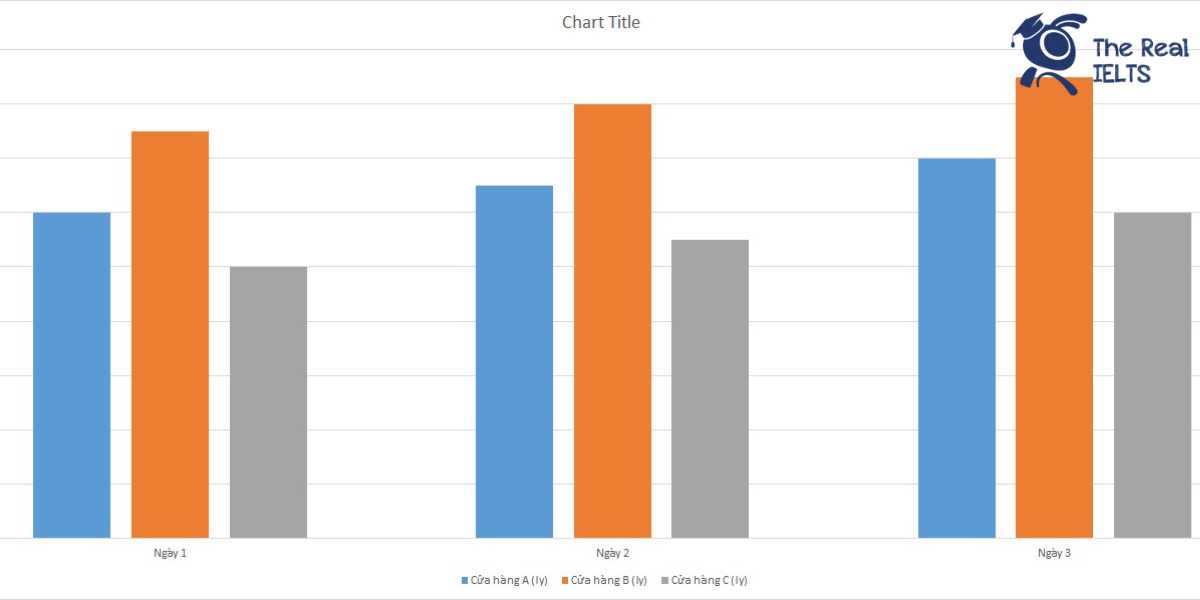
| Ngày | Cửa hàng A (ly) | Cửa hàng B (ly) | Cửa hàng C (ly) |
| Ngày 1 | 120 | 150 | 100 |
| Ngày 2 | 130 | 160 | 110 |
| Ngày 3 | 140 | 170 | 120 |

Bài mẫu 1
Overview
The following report analyzes the coffee consumption over three days at three different cafes: Café A, Café B, and Café C. The data, presented in a table, details the number of coffee cups sold each day by these cafes. This information provides insights into the sales performance and trends in coffee consumption across the given period.
Body 1: Daily Coffee Consumption
On Day 1, Café A sold 120 cups of coffee, while Café B led with 150 cups, and Café C sold the least at 100 cups. This indicates that Café B was the most popular destination for coffee on the first day, with Café A following and Café C lagging behind.
On Day 2, all three cafes saw an increase in sales. Café A sold 130 cups, Café B increased its lead with 160 cups, and Café C sold 110 cups. The trend of Café B leading the market continued, showing a consistent preference among customers for this café.
Body 2: Trends and Performance
On Day 3, the upward trend in coffee consumption persisted. Café A sold 140 cups, Café B reached 170 cups, and Café C sold 120 cups. Over the three days, each café experienced a steady increase in coffee sales. Café B consistently outperformed the other two cafes, showing a strong customer base and possibly more effective marketing or better location. Café A also demonstrated a steady increase in sales, although at a slower rate compared to Café B. Café C, while also increasing its sales, remained the least popular of the three.
In conclusion, the data reveals that Café B is the top performer in coffee sales, followed by Café A and then Café C. The steady increase in sales across all three cafes suggests a growing demand for coffee over the observed period.
Bài mẫu 2
Overview
This report presents the coffee consumption statistics over three days for three different coffee shops: Shop A, Shop B, and Shop C. The data is represented in cups consumed per day for each shop, providing an insight into their daily sales and popularity.
Body 1
Day 1 Consumption:
On the first day, Shop A sold 120 cups of coffee, which is a moderate amount compared to the other two shops. Shop B had the highest sales with 150 cups, indicating a stronger customer base or higher foot traffic. Shop C sold 100 cups, the lowest among the three. This initial data suggests that Shop B had a significant advantage over the others on the first day.
Day 2 Consumption:
The second day saw an increase in coffee consumption for all three shops. Shop A increased its sales to 130 cups, showing a positive trend. Shop B continued to lead with 160 cups, maintaining its top position. Shop C also saw a rise in sales, reaching 110 cups. This consistent increase across all shops indicates a growing demand for coffee and possibly better marketing or customer retention strategies.
Body 2
Day 3 Consumption:
On the third day, all three shops experienced further growth in their coffee sales. Shop A reached 140 cups, demonstrating a steady improvement over the three days. Shop B remained the highest seller with 170 cups, solidifying its dominance in coffee sales. Shop C also improved, selling 120 cups. The data from the third day confirms a continuous upward trend in coffee consumption for all three shops.
Conclusion
Overall, the three-day data shows a clear pattern of increasing coffee consumption across all three shops. Shop B consistently outperformed Shop A and Shop C, indicating it might have better customer attraction or service quality. Shop A and Shop C also showed positive growth, suggesting effective strategies in place. This analysis highlights the competitive nature of the coffee shop market and the importance of maintaining high standards to attract and retain customers.