IELTS Writing Task 1 yêu cầu bạn mô tả biểu đồ bar chart về số lượng vụ án hình sự theo tháng của ba thành phố. Bạn cần phân tích và so sánh số liệu, nhấn mạnh những điểm nổi bật và xu hướng chính. Bài viết nên bao gồm các số liệu cụ thể và ngôn ngữ mô tả rõ ràng.
Đọc bài này Cách làm bài IELTS Writing Task 1 Bar Chart trước khi làm bài.
Bạn cũng có thể đọc lại bài nói về Task 1 tại đây: IELTS Writing Task 1 cần lưu ý những gì?
Đọc thêm về xây dựng lộ trình học IELTS của The Real IELTS.
IELTS Writing Task 1 Bar Chart: Criminal Cases
You should spent about 20 mintutes on this task
IELTS Writing Task 1 requires you to describe a bar chart showing the monthly number of criminal cases in three cities. You need to analyze and compare the data, highlighting key points and main trends. The essay should include specific figures and clear descriptive language.
You should write at least 150 words
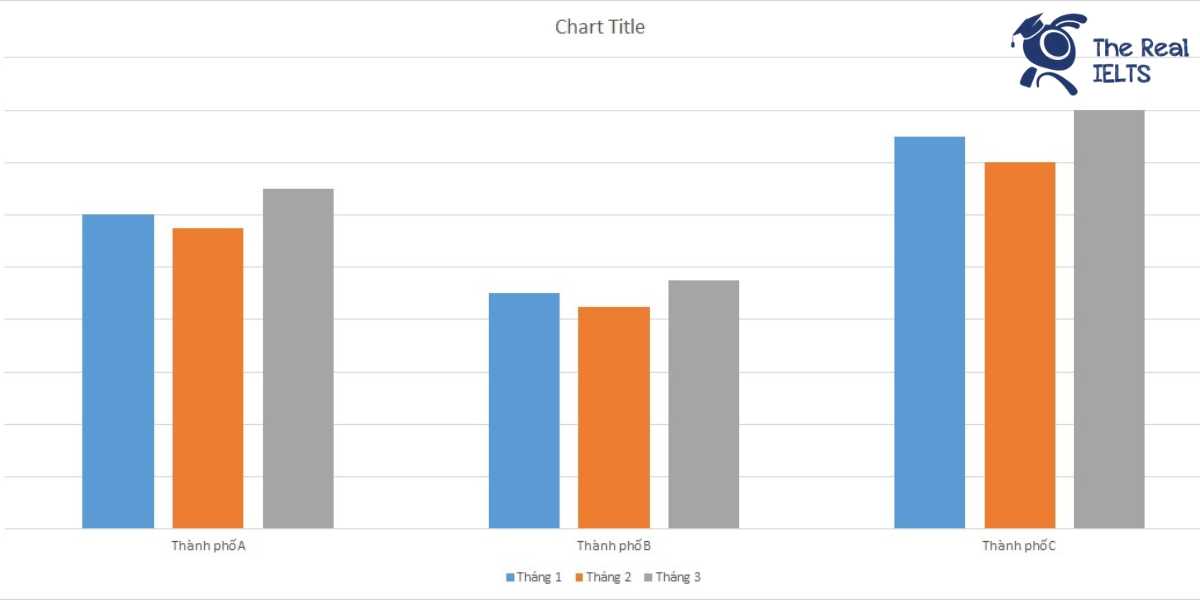
| Thành phố | Tháng 1 | Tháng 2 | Tháng 3 |
| Thành phố A | 120 | 115 | 130 |
| Thành phố B | 90 | 85 | 95 |
| Thành phố C | 150 | 140 | 160 |

Bài mẫu 1
Introduction
The table provides data on the number of criminal cases recorded in three cities over a period of three months: January, February, and March.
Overview
Overall, City C consistently had the highest number of criminal cases each month, whereas City B had the lowest. The number of cases fluctuated slightly in each city over the three months, with a general increase in March.
Body 1
In January, City A recorded 120 cases, which slightly decreased to 115 in February but rose again to 130 in March. City B followed a similar trend with 90 cases in January, a slight drop to 85 in February, and an increase to 95 in March. Both cities showed a dip in February followed by a rise in March.
Body 2
City C had the highest figures each month, starting with 150 cases in January, decreasing to 140 in February, and reaching a peak of 160 cases in March. This indicates a more significant fluctuation compared to Cities A and B. The consistent pattern across all cities suggests a potential seasonal effect or other external factors influencing the number of criminal cases.
Bài mẫu 2:
Introduction:
The table provides data on the number of criminal cases reported in three cities—City A, City B, and City C—over the span of three months: January, February, and March.
Overview:
Overall, City C consistently recorded the highest number of criminal cases each month, while City B reported the lowest. All three cities showed fluctuations in the number of reported cases, with an overall upward trend from February to March.
Body 1:
In January, City A had 120 criminal cases, which slightly decreased to 115 in February before rising to 130 in March. City B followed a similar pattern, starting with 90 cases in January, dropping to 85 in February, and then increasing to 95 in March.
Body 2:
City C had the highest number of cases among the three cities throughout the period, with 150 cases in January, decreasing to 140 in February, and then peaking at 160 in March. This city exhibited the most significant month-on-month variations compared to Cities A and B.