IELTS Writing Task 1 Bar Chart: Employment Rate. Bar Chart minh họa tỷ lệ người dân có việc làm trong ba tháng ở ba khu vực khác nhau. Số liệu này giúp ta thấy rõ sự khác biệt về tình trạng việc làm giữa các khu vực, từ đó rút ra những nhận định quan trọng về thị trường lao động. Bài viết sẽ phân tích chi tiết các xu hướng và biến động của từng khu vực qua từng tháng.
Đọc bài này Cách làm bài IELTS Writing Task 1 Bar Chart trước khi làm bài.
Bạn cũng có thể đọc lại bài nói về Task 1 tại đây: IELTS Writing Task 1 cần lưu ý những gì?
Đọc thêm về xây dựng lộ trình học IELTS của The Real IELTS.
IELTS Writing Task 1 Bar Chart: Employment Rate
You should spent about 20 mintutes on this task
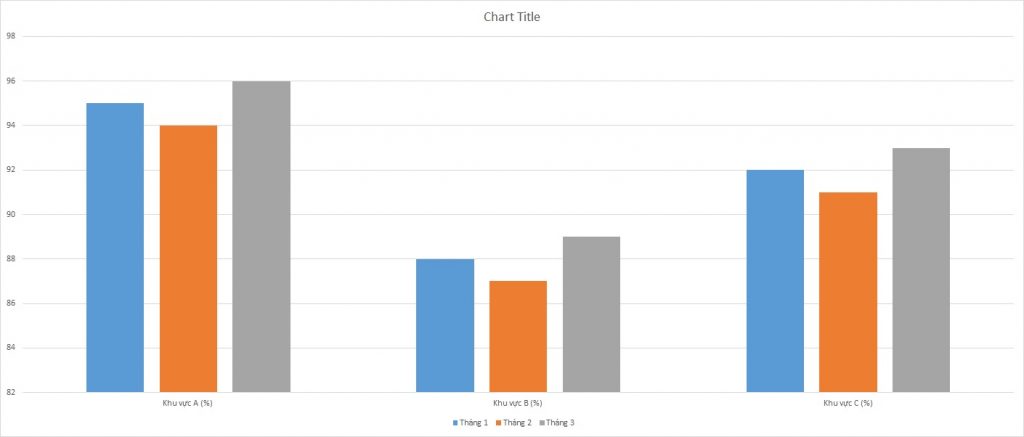
The Bar Chart illustrates the employment rate over three months in three different regions. This data allows us to clearly see the differences in employment conditions across these regions, thereby drawing important conclusions about the labor market. The essay will analyze the detailed trends and fluctuations in each region month by month.
You should write at least 150 words.
| Tháng | Khu vực A (%) | Khu vực B (%) | Khu vực C (%) |
| Tháng 1 | 95 | 88 | 92 |
| Tháng 2 | 94 | 87 | 91 |
| Tháng 3 | 96 | 89 | 93 |
Bài mẫu 1
Overview
The employment rates for three different regions, A, B, and C, over the span of three months are presented in the following analysis. The data provides a comparative view of how employment trends have shifted from January to March. This report aims to highlight the fluctuations in employment rates within these regions and discuss potential implications.
Body 1: Employment Trends in Region A
Region A consistently demonstrated high employment rates across the three months. In January, the employment rate was at 95%, slightly decreasing to 94% in February. However, the region saw a notable increase in March, reaching 96%, the highest among the three regions for any month. This upward trend suggests a strong and improving job market in Region A, possibly due to favorable economic conditions or effective employment policies.
Body 2: Employment Trends in Regions B and C
In Region B, the employment rate started at 88% in January, dropped to 87% in February, and then rose to 89% in March. Despite the fluctuations, the overall trend indicates a minor improvement by the end of the quarter. Region C displayed a steadier pattern compared to Region B, starting at 92% in January, slightly decreasing to 91% in February, and then increasing to 93% in March. Both regions show positive signs of recovery by the end of the period, but Region C remains consistently higher in employment rates compared to Region B.
Overall, the data reveals that all three regions experienced minor fluctuations but showed a general trend towards increased employment by March.
Bài mẫu 2
The table presents the employment rates over three months for three different areas, namely Area A, Area B, and Area C.
Overview: Overall, the data shows a consistent employment rate in all three areas, with Area A maintaining the highest employment rate each month, followed by Area C, and then Area B.
Body 1: In January, Area A had an employment rate of 95%, which is the highest among the three areas. Area C followed with a rate of 92%, and Area B had the lowest rate at 88%. In February, the employment rate in Area A decreased slightly to 94%. Similarly, the rates in Area B and Area C also decreased to 87% and 91%, respectively.
Body 2: In March, the employment rate in all three areas showed an increase compared to February. Area A’s rate rose to 96%, the highest across the three-month period. Area B’s rate increased to 89%, and Area C’s rate improved to 93%. Despite the fluctuations, Area A consistently had the highest employment rates, whereas Area B had the lowest across the three months.
In conclusion, while there were minor fluctuations in the employment rates over the three months, Area A consistently had the highest employment rates, and Area B had the lowest.