IELTS Writing Task 1 yêu cầu phân tích biểu đồ bar chart về số lượng học sinh giỏi trong ba năm tại ba trường học khác nhau. Biểu đồ minh họa sự thay đổi trong thành tích học tập của học sinh tại mỗi trường qua các năm, từ đó rút ra những nhận xét và so sánh về xu hướng và sự khác biệt giữa các trường. Phần mô tả cần chi tiết và rõ ràng, nhấn mạnh những điểm quan trọng của dữ liệu.
Đọc bài này Cách làm bài IELTS Writing Task 1 Bar Chart trước khi làm bài.
Bạn cũng có thể đọc lại bài nói về Task 1 tại đây: IELTS Writing Task 1 cần lưu ý những gì?
Đọc thêm về xây dựng lộ trình học IELTS của The Real IELTS.
IELTS Writing Task 1 Bar Chart: Excellent Students
You should spent about 20 mintutes on this task
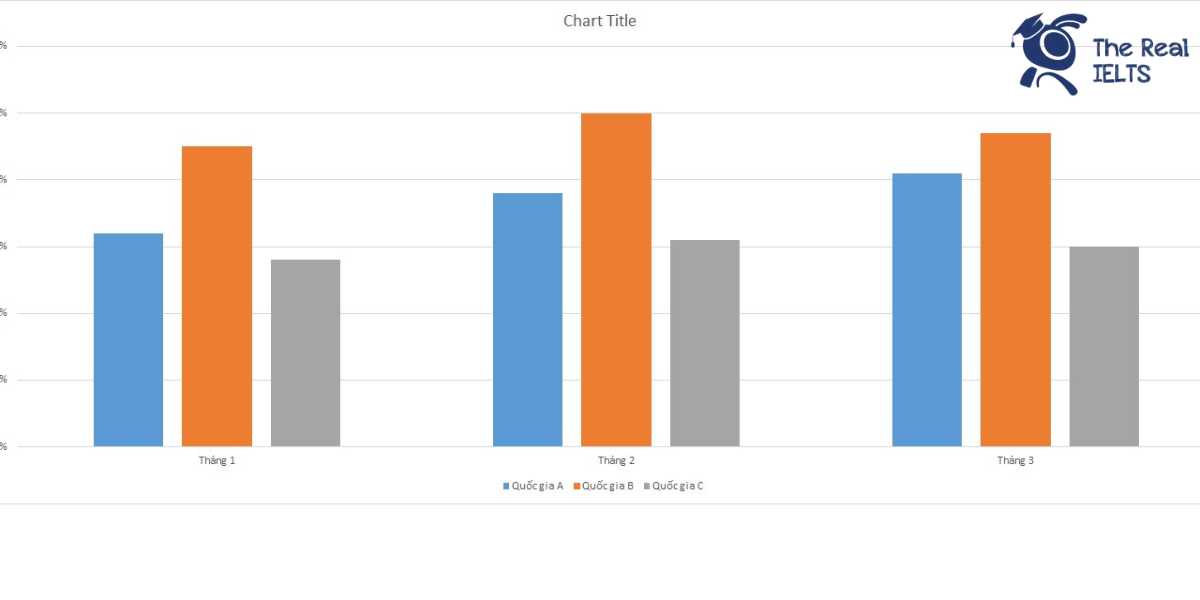
IELTS Writing Task 1 requires analyzing a bar chart showing the number of excellent students over three years at three different schools. The chart illustrates changes in students’ academic performance at each school over the years, drawing conclusions and comparisons about trends and differences between the schools. The description should be detailed and clear, highlighting the key points of the data.
You should write at least 150 words.
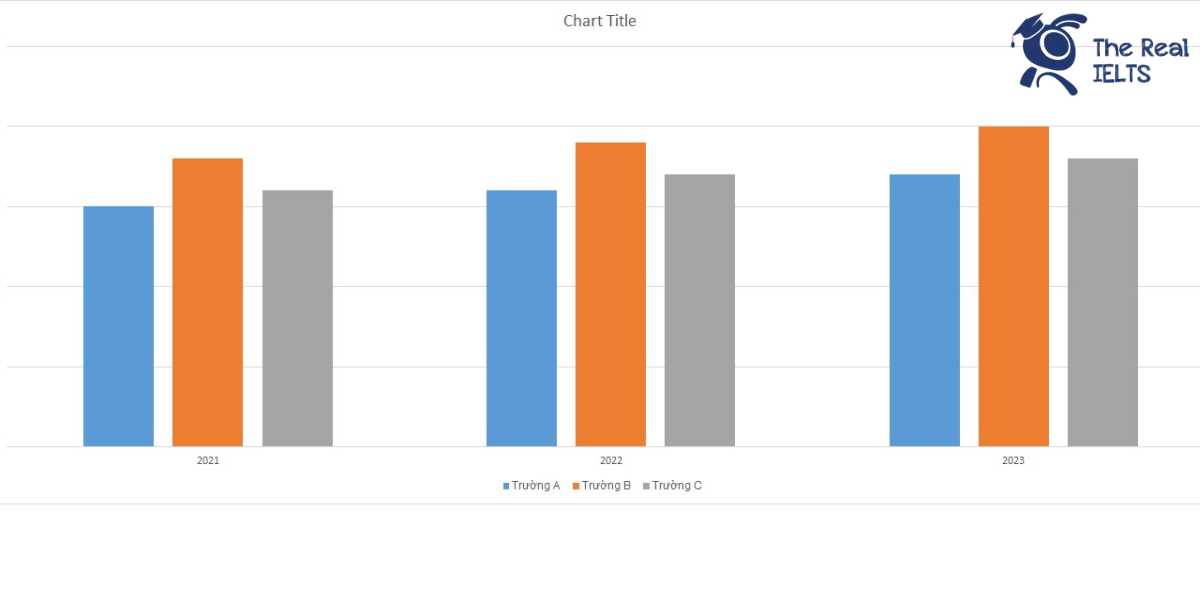
| Năm | Trường A | Trường B | Trường C |
| 2021 | 150 | 180 | 160 |
| 2022 | 160 | 190 | 170 |
| 2023 | 170 | 200 | 180 |

IELTS Writing 1
Overview
The table below shows the number of excellent students over three years (2021, 2022, and 2023) at three different schools: School A, School B, and School C. The data is hypothetical and aims to highlight trends and comparisons in student performance across these institutions.
Body 1
From the provided data, it is evident that all three schools have seen a consistent increase in the number of excellent students over the years. School A had 150 excellent students in 2021, which increased to 160 in 2022 and further to 170 in 2023. Similarly, School B started with 180 excellent students in 2021, rising to 190 in 2022 and reaching 200 by 2023. School C followed the same trend, with 160 excellent students in 2021, 170 in 2022, and 180 in 2023.
Body 2
When comparing the three schools, School B consistently had the highest number of excellent students each year, with a noticeable gap between it and the other two schools. School A had the lowest number of excellent students in 2021 and 2022 but showed a significant improvement by 2023. School C maintained a middle ground, with its number of excellent students always falling between those of Schools A and B. Overall, the data suggests a positive trend in academic excellence across all three schools, with each institution making steady progress year by year.
IELTS Writing 2
Overview
This report analyzes the number of excellent students at three different schools—School A, School B, and School C—over a three-year period from 2021 to 2023. The data showcases a consistent improvement in the academic performance of students at these institutions, reflecting their efforts to foster academic excellence.
Body 1
In 2021, School A reported 150 excellent students, School B had 180, and School C had 160. This year marked the starting point for the data, showing that School B had the highest number of excellent students, followed by School C, and then School A. The distribution of excellent students suggests that School B had a stronger academic program or support system for high-achieving students.
Body 2
The following years saw a steady increase in the number of excellent students across all three schools. By 2022, School A’s excellent students increased to 160, School B’s to 190, and School C’s to 170. In 2023, this upward trend continued with School A reaching 170, School B hitting 200, and School C achieving 180. The consistent growth over these years indicates effective strategies and continuous improvements in the educational approaches of all three schools. School B maintained its lead in fostering academic excellence, suggesting it might have implemented particularly effective educational practices or support mechanisms.
In summary, the data over the three years demonstrate a positive trend in academic performance across the three schools, with all institutions showing notable improvements and School B leading in the number of excellent students each year.