IELTS Writing Task 1 yêu cầu thí sinh miêu tả và phân tích biểu đồ Bar Chart về số lượng vụ cháy nổ trong ba tháng của ba phường. Thí sinh cần so sánh và chỉ ra xu hướng thay đổi của số vụ cháy giữa các phường, nhấn mạnh các điểm nổi bật và sự khác biệt đáng kể.
Đọc bài này Cách làm bài IELTS Writing Task 1 Bar Chart trước khi làm bài.
Bạn cũng có thể đọc lại bài nói về Task 1 tại đây: IELTS Writing Task 1 cần lưu ý những gì?
Đọc thêm về xây dựng lộ trình học IELTS của The Real IELTS.
IELTS Writing Task 1 Bar Chart: Fire Incidents
You should spent about 20 mintutes on this task
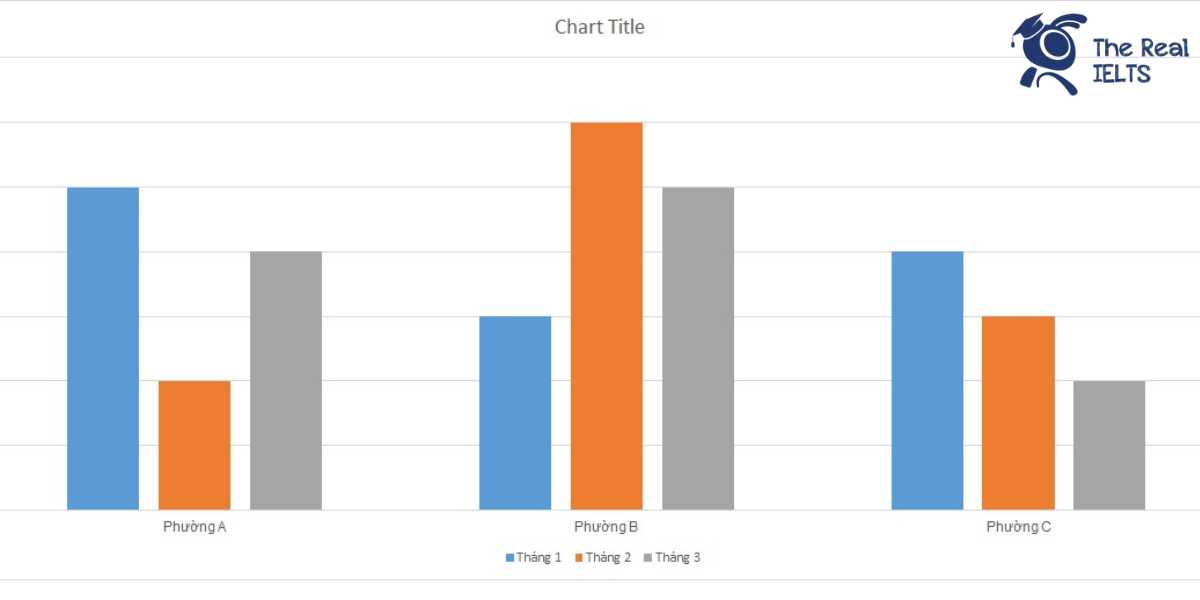
IELTS Writing Task 1 requires candidates to describe and analyze a Bar Chart illustrating the number of fire incidents over three months in three wards. Candidates need to compare and identify the trends in the number of fires among the wards, highlighting the notable points and significant differences.
You should write at least 150 words
| Tháng | Phường A | Phường B | Phường C |
| Tháng 1 | 5 | 3 | 4 |
| Tháng 2 | 2 | 6 | 3 |
| Tháng 3 | 4 | 5 | 2 |

Bài mẫu 1
Introduction
The table provides information on the number of fire incidents that occurred in three different wards (Ward A, Ward B, and Ward C) over a three-month period.
Overview
Overall, Ward A experienced the highest number of fire incidents in January, while Ward B had the most incidents in February. Ward C showed a relatively stable trend with minor fluctuations over the three months.
Body 1
In January, Ward A reported the highest number of incidents with 5, followed by Ward C with 4, and Ward B with 3. However, the trend reversed in February when Ward A saw a significant decrease in fire incidents, dropping to 2. Conversely, Ward B experienced a surge, leading the count with 6 incidents, whereas Ward C remained relatively stable with 3 incidents.
Body 2
March saw another shift in the pattern, with Ward B’s incidents decreasing to 5 and Ward A’s increasing to 4. Ward C reported the lowest number of incidents during this month, with only 2 cases. Overall, Ward A and Ward B demonstrated more variability in their incident counts compared to Ward C, which remained relatively consistent throughout the three months.
Bài mẫu 2
Introduction
The table provides a comparative analysis of the number of fire incidents in three different wards (A, B, and C) over a three-month period.
Overview
Overall, Ward A experienced the highest number of fire incidents in January, while Ward B had the highest in February and March. Ward C consistently reported the lowest or second-lowest incidents each month.
Body 1
In January, Ward A had the most fire incidents, with 5 cases reported, followed by Ward C with 4 cases, and Ward B with 3 cases. However, in February, the pattern shifted significantly. Ward B saw a substantial increase in incidents, rising to 6, making it the highest for that month. Meanwhile, Ward A experienced a notable decrease, reporting only 2 incidents, and Ward C saw a slight reduction, with 3 incidents.
Body 2
In March, the number of fire incidents in Ward A rose to 4, while Ward B experienced a minor decrease, recording 5 incidents. Ward C, on the other hand, reported the lowest number of incidents for March, with only 2 cases. This data indicates that while Ward A started with the highest number of incidents, Ward B took over in the subsequent months, showing a fluctuating pattern across all three wards.