IELTS Writing Task 1 yêu cầu bạn miêu tả lượng tiêu thụ thực phẩm trong 3 tuần của 3 gia đình qua biểu đồ Bar Chart. Biểu đồ này minh họa sự khác biệt trong thói quen ăn uống của mỗi gia đình, thể hiện lượng thực phẩm tiêu thụ hàng tuần, giúp đánh giá và so sánh thói quen tiêu thụ thực phẩm.
Đọc bài này Cách làm bài IELTS Writing Task 1 Bar Chart trước khi làm bài.
Bạn cũng có thể đọc lại bài nói về Task 1 tại đây: IELTS Writing Task 1 cần lưu ý những gì?
Đọc thêm về xây dựng lộ trình học IELTS của The Real IELTS.
IELTS Writing Task 1 Bar Chart: Food Consumption
You should spent about 20 mintutes on this task
IELTS Writing Task 1 requires you to describe the food consumption of three families over three weeks using a Bar Chart. This chart illustrates the differences in eating habits of each family, showing the weekly amount of food consumed, helping to evaluate and compare food consumption habits.
You should write at least 150 words
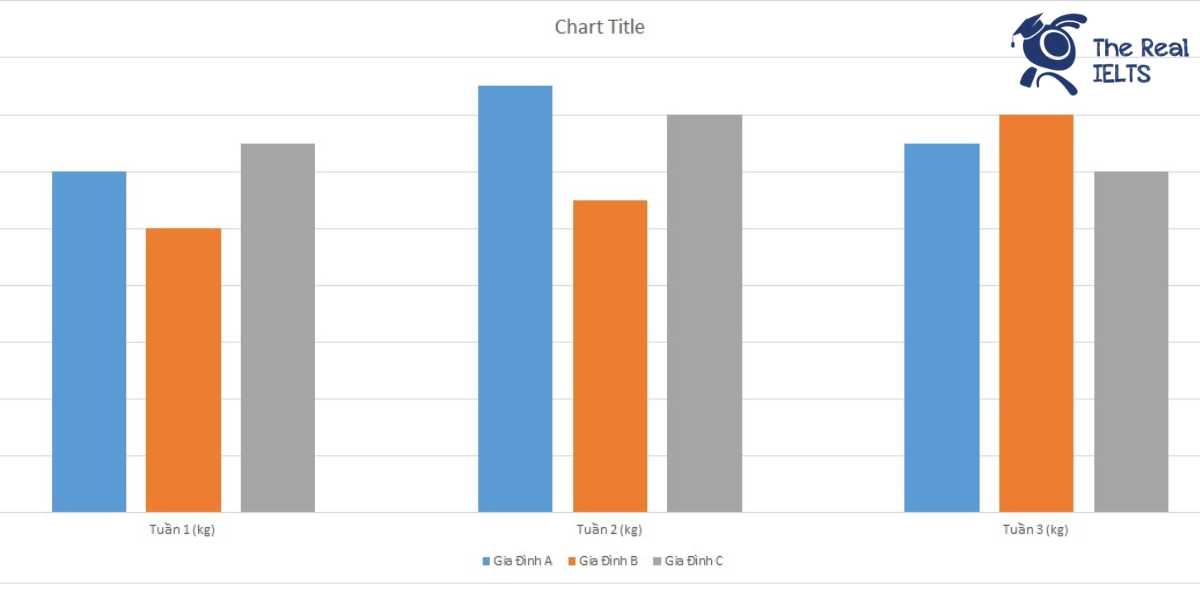
| Gia Đình | Tuần 1 (kg) | Tuần 2 (kg) | Tuần 3 (kg) |
| Gia Đình A | 12 | 15 | 13 |
| Gia Đình B | 10 | 11 | 14 |
| Gia Đình C | 13 | 14 | 12 |

Bài mẫu 1
The table illustrates the amount of food consumed by three families (Family A, Family B, and Family C) over three weeks, measured in kilograms.
Overall, Family A and Family B show an increasing trend in their food consumption from week 1 to week 2, while Family C’s consumption fluctuates. Family B has the most significant rise in food consumption over the period.
In detail, Family A’s consumption starts at 12 kg in week 1, increases to 15 kg in week 2, and then slightly decreases to 13 kg in week 3. Similarly, Family B begins with 10 kg in the first week, rising steadily to 11 kg in the second week and then jumping to 14 kg in the third week, which is their highest consumption level. On the other hand, Family C consumes 13 kg in week 1, slightly increases to 14 kg in week 2, and then decreases to 12 kg in week 3, showing some fluctuations in their consumption pattern.
In summary, Family B exhibits the most consistent increase in food consumption over the three weeks, while Family A shows a moderate increase followed by a slight decline. Family C’s consumption varies, with a peak in week 2 before decreasing in the final week.
Bài mẫu 2
Introduction
The table illustrates the food consumption in kilograms of three different families over a period of three weeks. The data includes Family A, Family B, and Family C, showing their weekly food intake.
Overview
Overall, it can be observed that there are fluctuations in the food consumption of each family over the three weeks. Family A and Family B show an increasing trend in their food consumption, while Family C displays a slight decrease.
Body 1
In the first week, Family A consumed 12 kg of food, which increased to 15 kg in the second week but slightly decreased to 13 kg in the third week. On the other hand, Family B started with 10 kg in the first week and saw a steady increase to 11 kg in the second week and 14 kg in the third week.
Body 2
Family C had the highest initial food consumption of 13 kg in the first week. Their consumption rose to 14 kg in the second week but then dropped to 12 kg in the third week. Despite the decline in the third week, Family C’s food consumption remained relatively stable compared to the other families.
Conclusion
In conclusion, while Family A and Family B showed an overall increase in food consumption over the three weeks, Family C experienced a slight decrease, indicating different consumption patterns among the families.