IELTS Writing Task 1 yêu cầu mô tả lượng tiêu thụ thực phẩm đông lạnh trong 3 ngày của ba thành phố qua biểu đồ cột. Biểu đồ này minh họa số liệu cụ thể về lượng thực phẩm tiêu thụ, giúp người viết so sánh và phân tích xu hướng tiêu dùng giữa các thành phố. Bài viết cần chú trọng vào việc miêu tả số liệu chính xác, nêu rõ sự khác biệt và điểm tương đồng giữa các thành phố trong khoảng thời gian được đề cập.
Đọc bài này Cách làm bài IELTS Writing Task 1 Bar Chart trước khi làm bài.
Bạn cũng có thể đọc lại bài nói về Task 1 tại đây: IELTS Writing Task 1 cần lưu ý những gì?
Đọc thêm về xây dựng lộ trình học IELTS của The Real IELTS.
IELTS Writing Task 1 Bar Chart: Frozen Food
You should spent about 20 mintutes on this task
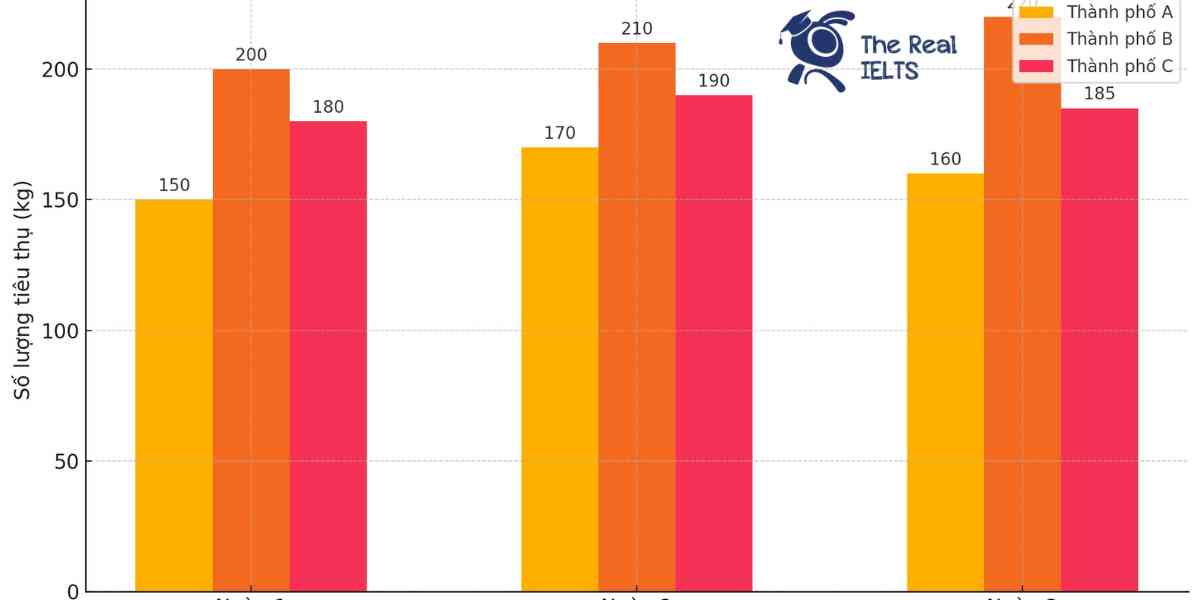
IELTS Writing Task 1 requires describing the consumption of frozen food over three days in three cities through a bar chart. This chart illustrates specific data on food consumption, helping the writer compare and analyze consumption trends between the cities. The essay should focus on accurately describing the figures, highlighting the differences and similarities between the cities over the specified period.
You should write at least 150 words.
| Thành phố | Ngày 1 | Ngày 2 | Ngày 3 |
| Thành phố A | 150 | 170 | 160 |
| Thành phố B | 200 | 210 | 220 |
| Thành phố C | 180 | 190 | 185 |

Bài mẫu 1
Overview
The consumption of frozen food over three days was recorded for three cities: Thành phố A, Thành phố B, and Thành phố C. This data provides insight into the trends and fluctuations in frozen food usage across different urban areas. By analyzing the consumption patterns, we can better understand the demand for frozen food products in these cities.
Body 1:
In Thành phố A, the consumption of frozen food showed some variation over the three days. On Ngày 1, the city consumed 150 kg of frozen food. This amount increased to 170 kg on Ngày 2, indicating a rise in demand. However, on Ngày 3, the consumption slightly decreased to 160 kg. This fluctuation suggests that while there was an increase in demand on the second day, it did not sustain into the third day.
Body 2:
Thành phố B demonstrated a steady increase in frozen food consumption over the three days. Starting at 200 kg on Ngày 1, the consumption rose to 210 kg on Ngày 2 and further to 220 kg on Ngày 3. This consistent upward trend indicates a growing demand for frozen food in Thành phố B.
Similarly, Thành phố C also showed an increase in consumption from Ngày 1 to Ngày 2, with figures rising from 180 kg to 190 kg. However, unlike Thành phố B, Thành phố C experienced a slight decrease on Ngày 3, with consumption dropping to 185 kg. This pattern suggests a peak in demand on the second day followed by a minor decline.
Bar Chart Representation
To visually represent the data, a bar chart can be used. Each city will have three bars corresponding to the three days. The x-axis will represent the days, while the y-axis will denote the amount of frozen food consumed in kilograms. This graphical representation will make it easier to compare the consumption patterns across the three cities over the three days.
Bài mẫu 2
Overview
The data provided outlines the consumption of frozen foods in three cities—City A, City B, and City C—over a span of three days. The units of measurement are in kilograms (kg). This report will analyze the trends in frozen food consumption, comparing the daily usage across the three cities and identifying patterns or significant changes in consumption levels.
Body 1
In City A, the consumption of frozen foods began at 150 kg on the first day. On the second day, there was a noticeable increase to 170 kg, indicating a 13.3% rise in consumption. However, on the third day, the consumption slightly decreased to 160 kg, representing a 5.9% drop from the previous day. This fluctuation might suggest a variability in demand or supply factors influencing daily consumption.
City B, on the other hand, showed a consistent increase in the consumption of frozen foods over the three days. Starting at 200 kg on the first day, the amount rose to 210 kg on the second day, marking a 5% increase. This trend continued into the third day with the consumption reaching 220 kg, another 4.8% increase. The steady rise in City B could be indicative of growing demand or a response to supply chain efficiencies or marketing efforts.
Body 2
City C’s data also indicates a gradual increase in frozen food consumption but with less variability compared to City A and B. The initial consumption was recorded at 180 kg on the first day. It rose to 190 kg on the second day, reflecting a 5.6% increase, and slightly decreased to 185 kg on the third day, a 2.6% drop. The minor fluctuations in City C suggest a relatively stable consumption pattern, possibly influenced by consistent consumer behavior or stable market conditions.
Overall, City B showed the highest levels of consumption each day, followed by City C and City A. The consistent increase in City B might point to a larger population or more significant marketing efforts for frozen foods. Meanwhile, the fluctuations in City A and the stability in City C highlight different consumption dynamics that could be influenced by various external factors such as pricing, availability, or cultural preferences.