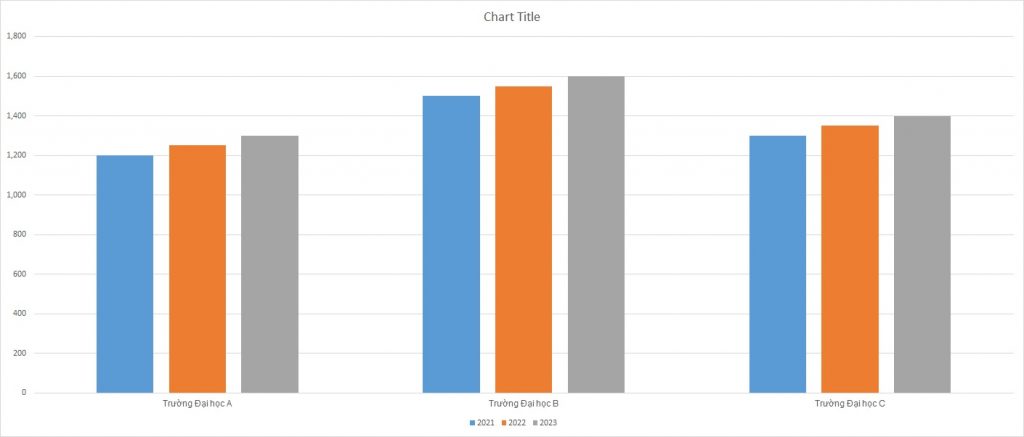
IELTS Writing Task 1 yêu cầu bạn phân tích số lượng sinh viên tốt nghiệp trong ba năm từ ba trường đại học, thể hiện qua biểu đồ cột. Bạn cần miêu tả các xu hướng chính, so sánh số liệu giữa các trường, và chỉ ra sự biến đổi qua các năm. Chú trọng việc sử dụng từ vựng chính xác và ngữ pháp đúng để cung cấp một bức tranh rõ ràng và toàn diện về dữ liệu được cung cấp.
Đọc bài này Cách làm bài IELTS Writing Task 1 Bar Chart trước khi làm bài.
Bạn cũng có thể đọc lại bài nói về Task 1 tại đây: IELTS Writing Task 1 cần lưu ý những gì?
Đọc thêm về xây dựng lộ trình học IELTS của The Real IELTS.
IELTS Writing Task 1 Bar Chart: Graduates
You should spent about 20 mintutes on this task
In IELTS Writing Task 1, you are required to analyze the number of graduates over three years from three universities, as presented in a bar chart. You need to describe the main trends, compare the data between universities, and highlight changes over the years. Pay attention to using precise vocabulary and correct grammar to provide a clear and comprehensive picture of the data provided.
You should write at least 150 words.
| Năm | Trường Đại học A | Trường Đại học B | Trường Đại học C |
| 2021 | 1,200 | 1,500 | 1,300 |
| 2022 | 1,250 | 1,550 | 1,350 |
| 2023 | 1,300 | 1,600 | 1,400 |


Bài mẫu 1
Overview
The number of students graduating from universities is an essential metric for understanding educational trends. This report examines the graduation data from three hypothetical universities: University A, University B, and University C over the years 2021, 2022, and 2023. The statistics provide insights into the growth patterns and relative performance of these institutions.
Body 1
In 2021, the data shows that University B had the highest number of graduates with 1,500 students. University C followed with 1,300 graduates, and University A had the lowest number with 1,200 graduates. This initial year sets a benchmark for analyzing subsequent growth and trends in the number of graduates from each university.
In 2022, all three universities saw an increase in the number of graduates. University A increased its graduates to 1,250, a rise of 50 students from the previous year. University B maintained its leading position by graduating 1,550 students, an increase of 50 as well. University C also saw an increase, with 1,350 graduates, marking a rise of 50 students.
Body 2
By 2023, the upward trend continued for all three universities. University A graduated 1,300 students, showing a consistent increase over the three years. University B remained the leader with 1,600 graduates, while University C had 1,400 graduates. The data for 2023 indicates a steady growth in the number of graduates, with each university showing a consistent increase of 50 graduates per year.
Overall, the statistics from 2021 to 2023 demonstrate a positive trend in the number of graduates from the three universities. University B consistently led in the number of graduates each year, followed by University C and University A. This growth highlights the expanding capacity and possibly the increasing popularity or effectiveness of these educational institutions.
Bài mẫu 2
Overview: Overall, the number of graduates increased steadily in all three universities during the period. University B consistently had the highest number of graduates each year, followed by University C and University A.
Body 1: In 2021, University A had 1,200 graduates, the lowest among the three universities, while University B led with 1,500 graduates. University C was in the middle with 1,300 graduates. The following year, 2022, saw a slight increase in graduates for all universities. University A increased by 50 graduates to 1,250, University B increased by 50 graduates to 1,550, and University C also saw an increase of 50 graduates, reaching 1,350.
Body 2: By 2023, all three universities continued their upward trend in the number of graduates. University A reached 1,300 graduates, an increase of 100 from 2021. University B continued to lead with 1,600 graduates, 100 more than in 2021. University C also saw a consistent rise, ending the period with 1,400 graduates, an increase of 100 compared to 2021. The data demonstrates a steady growth in the number of graduates from all three universities over the three-year period.


