IELTS Writing Task 1 yêu cầu thí sinh miêu tả chi phí sửa chữa nhà cửa của ba gia đình khác nhau trong ba tháng, được biểu thị bằng biểu đồ thanh. Biểu đồ này minh họa các mức chi phí sửa chữa nhà cửa của từng gia đình qua các tháng, giúp thí sinh rèn luyện kỹ năng phân tích số liệu và mô tả xu hướng. Việc so sánh chi phí giữa các gia đình và xác định biến động theo thời gian là những điểm cần lưu ý khi viết bài.
Đọc bài này Cách làm bài IELTS Writing Task 1 Bar Chart trước khi làm bài.
Bạn cũng có thể đọc lại bài nói về Task 1 tại đây: IELTS Writing Task 1 cần lưu ý những gì?
Đọc thêm về xây dựng lộ trình học IELTS của The Real IELTS.
IELTS Writing Task 1 Bar Chart: Home Repair
You should spent about 20 mintutes on this task
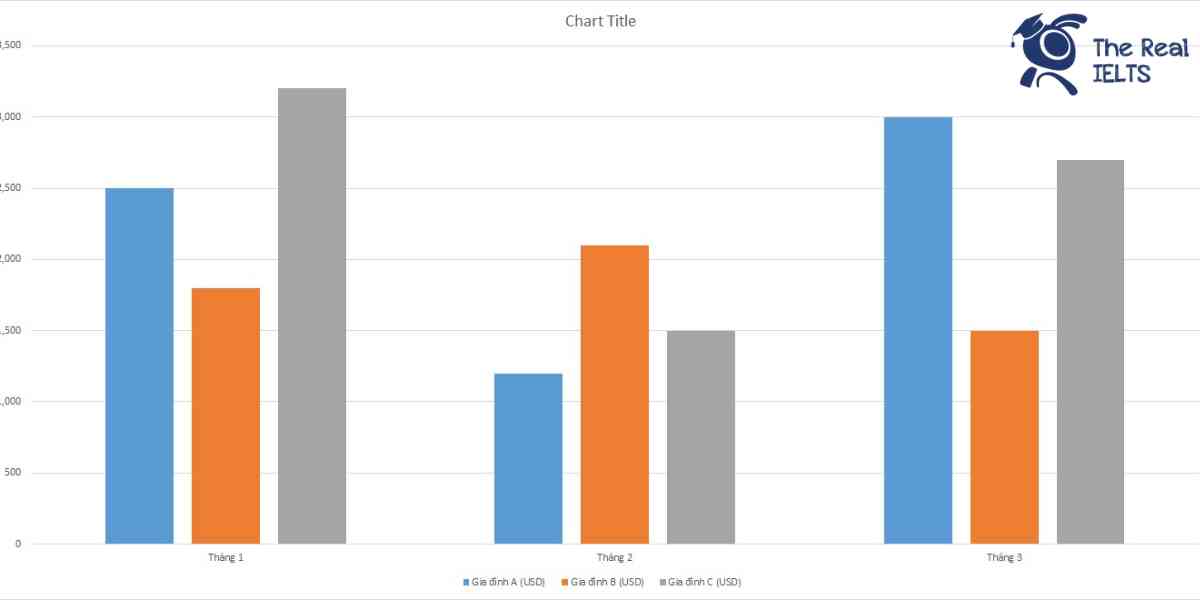
IELTS Writing Task 1 requires candidates to describe the home repair costs of three different families over three months, depicted in a bar chart. This chart illustrates the repair costs for each family over the months, helping candidates practice data analysis skills and trend descriptions. Comparing costs between families and identifying fluctuations over time are key points to consider when writing the task.
You should write at least 150 words.
| Tháng | Gia đình A (USD) | Gia đình B (USD) | Gia đình C (USD) |
| Tháng 1 | 2,500 | 1,800 | 3,200 |
| Tháng 2 | 1,200 | 2,100 | 1,500 |
| Tháng 3 | 3,000 | 1,500 | 2,700 |

Bài mẫu 1
Overview
The table presents the hypothetical monthly repair expenses of three different families (A, B, and C) over a span of three months. The data includes the costs for January, February, and March, highlighting the variations in spending among these families.
Body 1
In January, Family A had the highest expenditure at $2,500. Family B’s expenses were the lowest at $1,800, while Family C’s costs were the highest among all families at $3,200. The significant difference in costs indicates varying degrees of repair work needed or different approaches to managing home repairs.
In February, the expenses shifted notably. Family A managed to reduce their costs significantly to $1,200, whereas Family B’s expenses increased slightly to $2,100. Family C also saw a significant reduction in their repair costs, bringing it down to $1,500. This month shows a trend of reduced spending for Families A and C, possibly due to fewer repairs needed or better budgeting.
Body 2
March brought another change in the expenditure pattern. Family A’s repair costs surged to $3,000, marking the highest spending for this family over the three months. Family B reduced their expenses to $1,500, the lowest among the three families in March. Family C’s expenses increased to $2,700, though not as high as in January.
In conclusion, the repair costs for the three families varied significantly over the three months. Family A experienced the most fluctuation, while Family B’s costs were more stable, and Family C’s expenses, although high initially, showed a decreasing trend by March. This variation highlights the unpredictability and the different financial management strategies of each family regarding home repairs.
Bài mẫu 2
Overview
This report examines the monthly home repair expenses of three different families (A, B, and C) over a three-month period. The data presented provides insight into the spending patterns of each family and highlights any significant variations or trends in their repair costs.
Body 1
In January, Family A spent $2,500 on home repairs, Family B incurred $1,800 in expenses, and Family C had the highest expenditure at $3,200. This month shows a noticeable difference in spending, with Family C spending significantly more than Families A and B. The higher cost for Family C could indicate major repairs or multiple maintenance activities undertaken during this period.
In February, there was a shift in spending patterns. Family A’s expenses dropped to $1,200, reflecting a substantial decrease from the previous month. In contrast, Family B’s expenses increased to $2,100, indicating a possible major repair or series of maintenance tasks. Family C also saw a significant reduction in their expenses, dropping to $1,500. This month’s data shows a more balanced distribution of costs among the families compared to January.
Body 2
March saw another change in the repair expenses for each family. Family A’s costs rose sharply to $3,000, marking the highest single month expenditure for them in the three-month period. Family B’s expenses decreased to $1,500, showing a consistent decline from the previous month’s peak. Family C’s repair costs increased to $2,700, though not as high as their January expenses.
Over the three months, Family A’s expenses fluctuated significantly, starting high, dropping in February, and peaking in March. Family B’s spending showed a more moderate variation with an increase in February followed by a decrease in March. Family C, despite the high initial cost, managed to lower their expenses in February but saw an increase again in March. The data suggests different maintenance strategies or varying levels of repair needs among the three families over the observed period.