IELTS Writing Task 1 yêu cầu bạn phân tích và mô tả dữ liệu từ biểu đồ. Trong bài này, bạn sẽ xem xét tỷ lệ người dân sử dụng Internet trong 3 tháng của 3 thành phố thông qua một Bar Chart. Bằng cách so sánh các thành phố này, bạn sẽ phân tích xu hướng và đưa ra nhận xét về sự khác biệt giữa các thành phố. Điều này giúp bạn phát triển kỹ năng phân tích dữ liệu và viết báo cáo chính xác trong kỳ thi IELTS.
Đọc bài này Cách làm bài IELTS Writing Task 1 Bar Chart trước khi làm bài.
Bạn cũng có thể đọc lại bài nói về Task 1 tại đây: IELTS Writing Task 1 cần lưu ý những gì?
Đọc thêm về xây dựng lộ trình học IELTS của The Real IELTS.
IELTS Writing Task 1 Bar Chart: Internet Usage 2
You should spent about 20 mintutes on this task
IELTS Writing Task 1 requires you to analyze and describe data from a chart. In this task, you will examine the internet usage rates of three cities over three months using a Bar Chart. By comparing these cities, you will analyze trends and make observations about the differences between them. This helps you develop skills in data analysis and accurate report writing for the IELTS exam.
You should write at least 150 words.
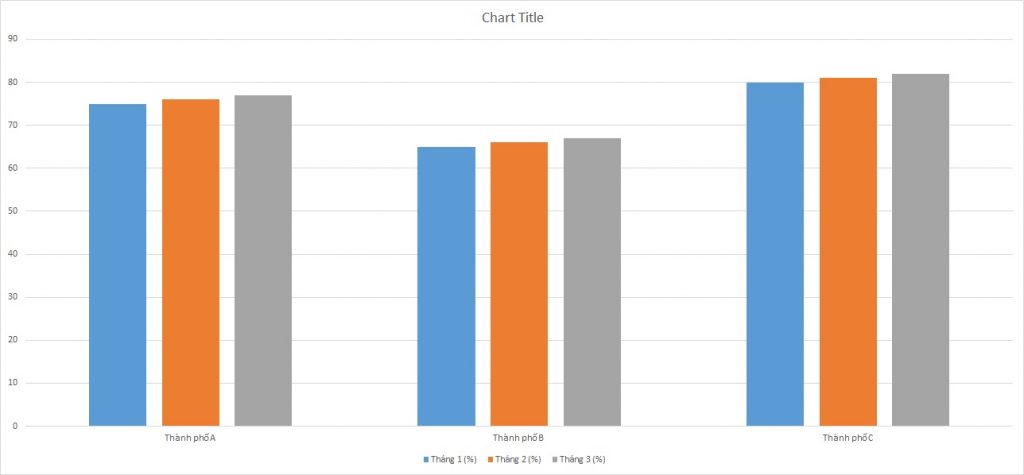
| Thành phố | Tháng 1 (%) | Tháng 2 (%) | Tháng 3 (%) |
| Thành phố A | 75 | 76 | 77 |
| Thành phố B | 65 | 66 | 67 |
| Thành phố C | 80 | 81 | 82 |


Bài mẫu 1
Overview
This report presents the internet usage rates over a three-month period in three hypothetical cities: City A, City B, and City C. The data provides insight into the percentage of the population using the internet in January, February, and March. Observing these trends helps understand how internet usage varies across different urban areas and over time.
Body 1
In January, City A had an internet usage rate of 75%, which increased to 76% in February and further to 77% in March. This steady growth indicates a consistent rise in internet adoption among its residents. City A’s incremental increase of 1% each month suggests a gradual yet stable upward trend in digital connectivity.
Body 2
City B showed a similar pattern but with lower initial percentages. Starting at 65% in January, the internet usage in City B rose to 66% in February and 67% in March. Though the percentage increases are consistent, the overall usage rate remains lower compared to City A and City C. This could imply either a slower adoption rate or different socio-economic factors affecting internet usage.
City C had the highest internet usage rates among the three cities. Beginning at 80% in January, the usage increased to 81% in February and 82% in March. The higher base rate and consistent monthly growth indicate that City C has a well-established internet infrastructure and higher overall adoption compared to the other two cities.
In conclusion, all three cities exhibit a steady increase in internet usage over the observed period. City C leads in overall usage, followed by City A and City B. Understanding these trends is crucial for planning and improving digital services and infrastructure in urban areas.
Bài mẫu 2
Overview
This report presents the internet usage statistics of three hypothetical cities: City A, City B, and City C over a three-month period. The data reveals the percentage of the population using the internet in January, February, and March.
Body 1
City A demonstrates a steady increase in internet usage. In January, 75% of the population used the internet, which rose slightly to 76% in February and then to 77% in March. This consistent growth suggests a positive trend in the adoption of internet services among the residents. The 1% monthly increase indicates a stable and gradual rise in internet connectivity within the city.
Body 2
City B shows a similar pattern of incremental growth in internet usage, albeit starting from a lower base compared to City A. In January, 65% of the population used the internet. This figure increased to 66% in February and reached 67% in March. While the growth rate mirrors that of City A, the overall percentage remains lower, indicating that City B has a relatively smaller proportion of internet users.
City C, on the other hand, leads in internet usage among the three cities. Starting at 80% in January, the percentage of internet users increased to 81% in February and further to 82% in March. This higher base level of internet penetration suggests that City C has more advanced digital infrastructure and higher internet adoption rates compared to the other two cities. The 1% monthly increase, while consistent, indicates that City C is already nearing saturation in terms of internet usage, with a high proportion of its population already connected.


