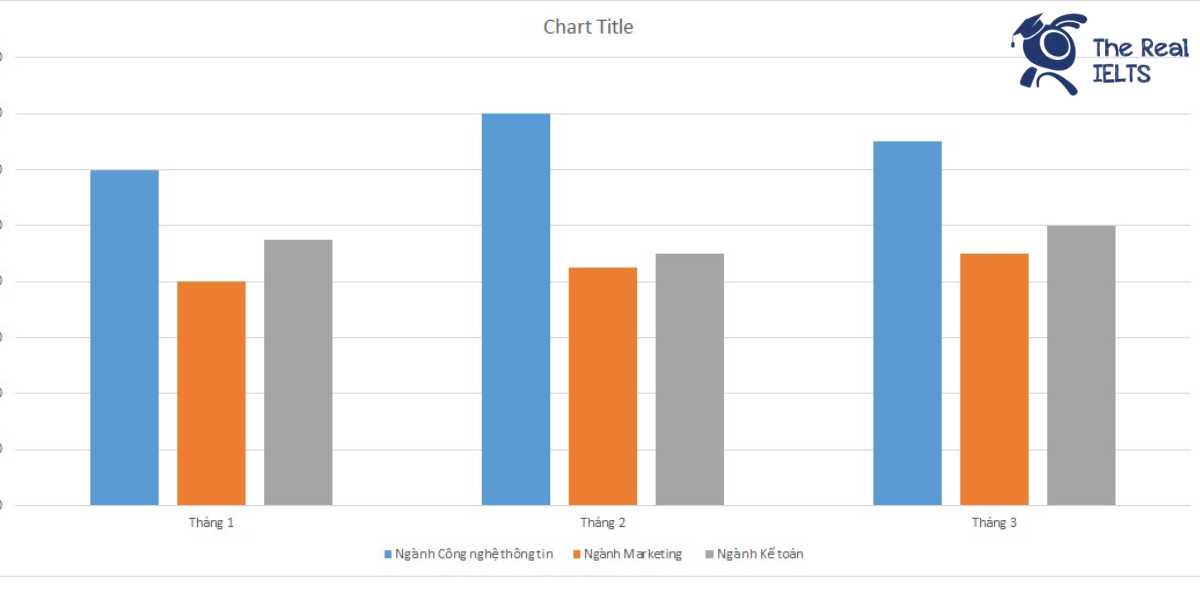
IELTS Writing Task 1 yêu cầu bạn mô tả biểu đồ cột thể hiện số lượng ứng viên tham gia phỏng vấn trong ba tháng qua ở ba ngành nghề khác nhau. Biểu đồ minh họa sự thay đổi về số lượng ứng viên mỗi tháng, giúp bạn rèn luyện kỹ năng mô tả xu hướng và so sánh dữ liệu một cách rõ ràng và chính xác.
Đọc bài này Cách làm bài IELTS Writing Task 1 Bar Chart trước khi làm bài.
Bạn cũng có thể đọc lại bài nói về Task 1 tại đây: IELTS Writing Task 1 cần lưu ý những gì?
IELTS Writing Task 1 Bar Chart: Interviews
You should spent about 20 mintutes on this task
IELTS Writing Task 1 requires you to describe a bar chart showing the number of applicants participating in interviews over the past three months in three different sectors. The chart illustrates the changes in the number of applicants each month, helping you practice skills in describing trends and comparing data clearly and accurately.
You should write at least 150 words.
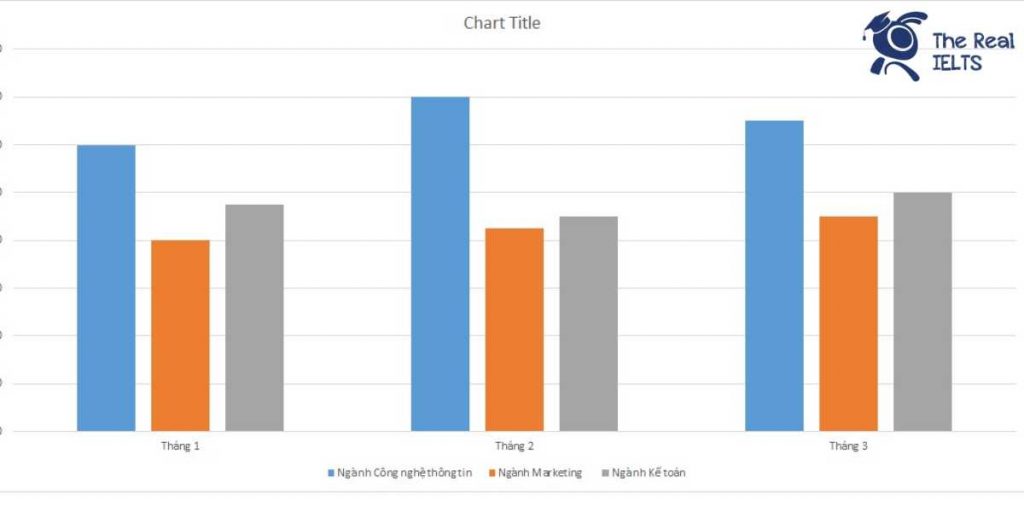
| Tháng | Ngành Công nghệ thông tin | Ngành Marketing | Ngành Kế toán |
| Tháng 1 | 120 | 80 | 95 |
| Tháng 2 | 140 | 85 | 90 |
| Tháng 3 | 130 | 90 | 100 |

Bài mẫu 1
Introduction:
The table presents data on the number of candidates attending interviews across three different sectors—Information Technology (IT), Marketing, and Accounting—over a period of three months.
Overview:
Overall, the IT sector consistently attracted the highest number of candidates each month, while the Marketing sector had the fewest. Despite fluctuations, all sectors experienced an increase in candidate numbers by March compared to January.
Body 1:
In January, the IT sector had the most candidates with 120, followed by Accounting with 95, and Marketing with 80. February saw a rise in IT and Marketing candidates to 140 and 85 respectively, whereas Accounting saw a slight drop to 90. The number of candidates for IT peaked in February, showing the highest month-on-month growth.
Body 2:
By March, the number of IT candidates decreased slightly to 130, but it remained the highest among the three sectors. Marketing continued its upward trend, reaching 90 candidates, while Accounting saw an increase to 100, surpassing its January figures. This indicates a growing interest in Accounting towards the end of the period.
Conclusion:
In summary, the IT sector remained the most popular among candidates, despite a slight dip in March. Both Marketing and Accounting showed a steady increase in candidates over the three months, with Accounting experiencing a notable rise in the final month.
Bài mẫu 2
The table illustrates the number of candidates attending interviews in three different sectors – Information Technology (IT), Marketing, and Accounting – over a three-month period.
Overall, the IT sector consistently had the highest number of interviewees each month, whereas Marketing attracted the fewest candidates. The Accounting sector experienced a steady increase in the number of candidates throughout the three months.
In January, 120 candidates interviewed for IT positions, 80 for Marketing, and 95 for Accounting. The following month saw a rise in IT and Marketing interviews, with 140 and 85 candidates respectively, while Accounting saw a slight drop to 90 candidates.
March experienced a slight decrease in IT interviews to 130 candidates, whereas Marketing saw an increase to 90 candidates. Accounting continued its upward trend, reaching 100 candidates by the end of the three months.
In summary, the IT sector maintained the highest number of interviewees, Marketing saw gradual growth, and Accounting demonstrated consistent increases month by month.
Bài mẫu 3
Introduction:
The table provides statistical data on the number of applicants attending interviews over a three-month period in three different sectors: Information Technology, Marketing, and Accounting.
Overview:
Overall, the Information Technology sector consistently attracted the highest number of applicants each month. Conversely, the Marketing sector had the lowest number of applicants initially, though it saw a gradual increase. Accounting had a relatively stable number of applicants with a slight upward trend towards the end.
Body 1:
In January, Information Technology had the highest number of interviewees at 120, followed by Accounting with 95, and Marketing with 80. The trend continued in February, where Information Technology saw an increase to 140 applicants. Marketing experienced a minor rise to 85, while Accounting saw a slight decrease to 90.
Body 2:
March witnessed a decline in the number of applicants for Information Technology, dropping to 130, yet it still led compared to the other sectors. Marketing continued its steady rise, reaching 90 applicants. Accounting, on the other hand, experienced an increase to 100 applicants, marking the highest number for this sector during the three-month period.
In summary, the Information Technology sector consistently attracted the most applicants, while Marketing had the lowest numbers but showed a consistent upward trend. Accounting remained relatively stable with a slight increase in March.


